Bitcoin, Litecoin Continue Downtrends May 2018
Both bitcoin and litecoin are continuing their downtrends. Bitcoin is quoted at $8,290 right now, lower by 4.5 percent since last Tuesday. Litecoin is trading at $133 dollars, down by 9.5 percent.
Bitcoin Still Bearish
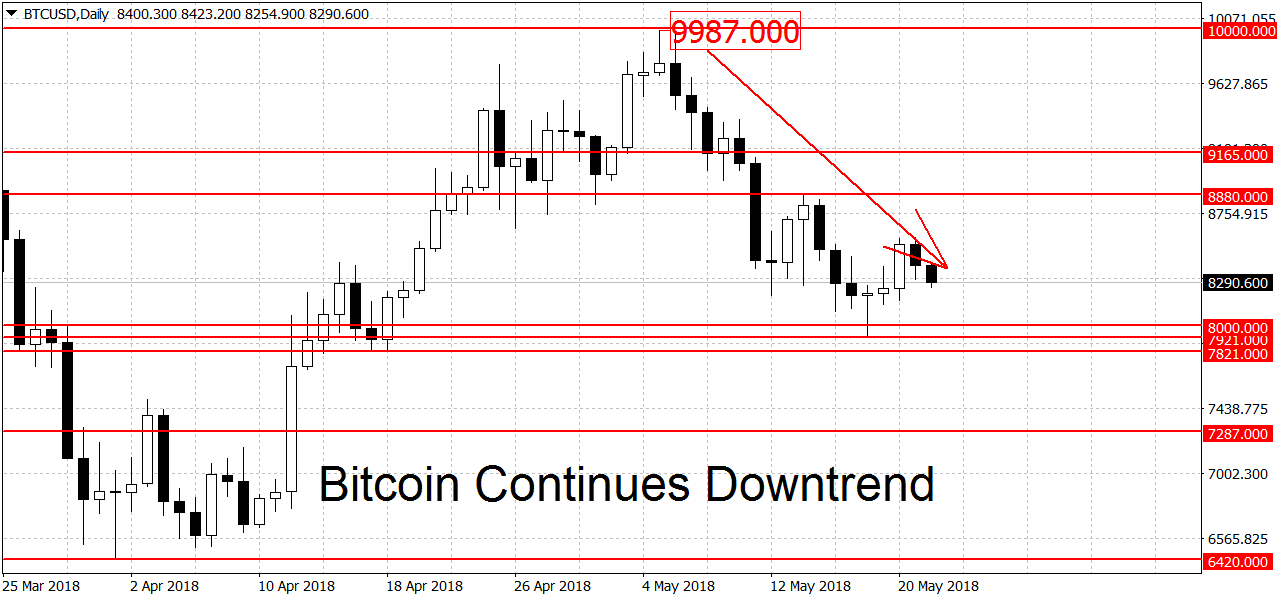
Bitcoin is still looking bearish on the daily charts. On Friday we hit a new interim low of $7,921 but from here we got a bounce to $8,590 dollars. Right now we’re somewhat in between these two figures at $8,290 dollars.
To end the current downtrend the bulls will have to push us above the $8,880 swing high.Resistance higher up can be found at the $9,000 mark followed by the swing highs at $9,387 and $9,759 dollars. All of these levels are weak resistance points however. We have much stronger resistance area around the top of the previous bull run which was at $9,987 dollars. A breakout above the $10,000 round figure is needed to kick-start a new rally.
There’s a support area below between $7,821 and $8,000 dollars. A break of it could lead to extended losses toward the next strong support area in the $6,420 to $6,600 dollars range. This is where we bottomed out during the last major sell-off. A decisive break below here could open the door for a break of this year’s low at $5,980 dollars.
On the fundamental front there haven’t been any major news events during the past seven days. After the end of Consensus 2018 we are in a bit of lull in terms of scheduled news catalysts. There’s no change on the longer-term weekly and monthly charts. The weekly is looking range-bound while the monthly is still bullish.
Litecoin Remains in Downtrend
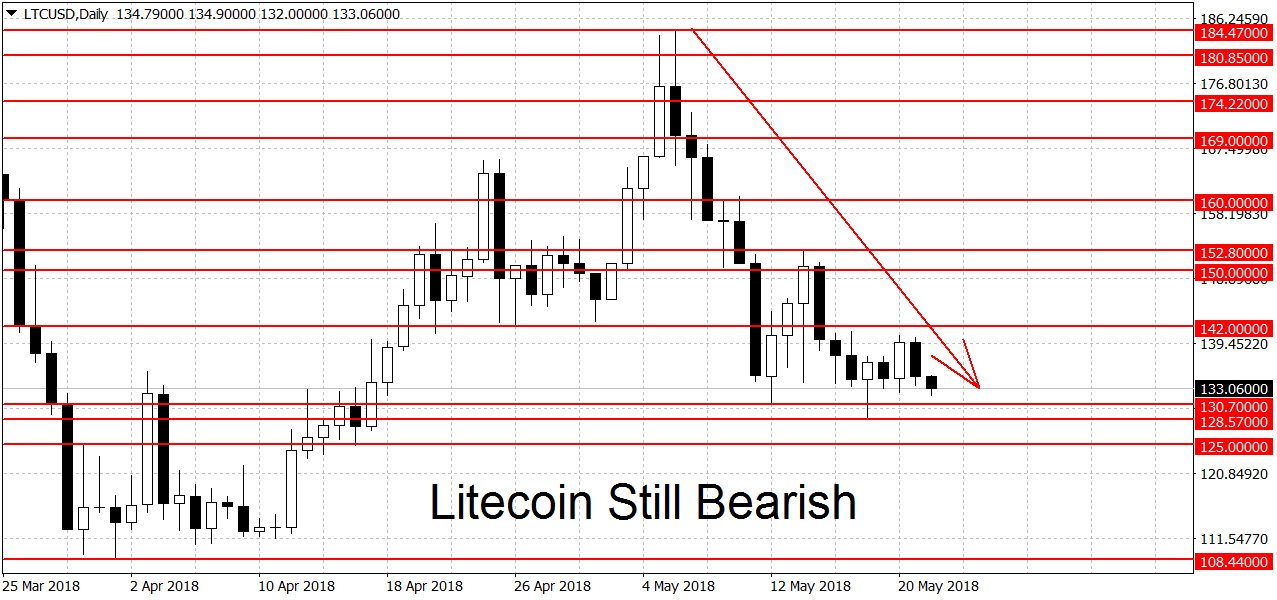
Similarly to bitcoin, litecoin too remains in a downtrend. We are currently quoted at $133 dollars and trading just above a set of several potential support levels at $130.70, $128.57 and $125 dollars. A clearing of this support area should lead to further losses.
The first strong level of support after this area can be found at the $108.44 swing low. The low for 2018 is close to here at $105.55 dollars, some traders may choose to wait until that level is taken out as well. Further down the $100 round figure may also act as weak support to falling prices.
On the top end we have resistance at $142 dollars followed by the $150 round figure. Higher up a breakout above the $152.80 swing low would end the current bearish trend on the daily charts. A move above the $184.47 swing high is needed for a new LTC rally. On the longer-term weekly and monthly charts LTC/USD is still looking bullish.