


FXOpen
Bitcoin is testing the important swing resistance at $243/$244 dollars per coin. The high, initially hit on April 28th during a 1 hour spike, is proving to be of a more permanent character and remains unbroken after two failed attempts. While bitcoin was struggling to break above $244, Litecoin had the same issue with $1.50. But let’s start with big brother first.
Bitcoin Tests $244 Resistance
Bitcoin failed to breakout above $244 on April 30th and May 3rd. In both cases, prices barely broke the previous high by less then 20 cents before falling back. We are currently trading at $236 dollars per coin, substantially below the $244 mark.
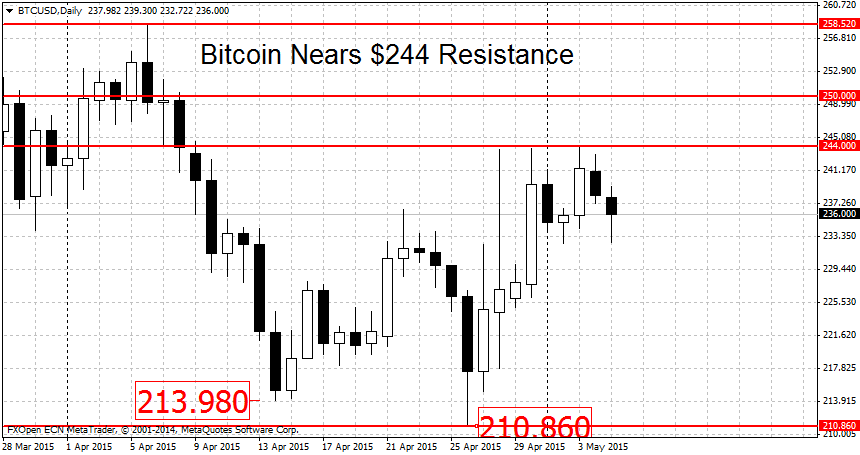
While the downtrend is over, we are still not in an uptrend. For this, BTC/USD will need to rally above the $250 mark. Above here weak resistance stands at $258, followed by $270. The major figure on the upside is the $300 round level. This is also the high of a triple top formation. A break above $300 should intensify the gains.
On the lower end, some support can be found at $230, followed by the April 26th swing low at $210. In fact, as we’ve mentioned before, the whole area from $200 to $210 should be treated as one large support level. Thus we will need to see a break below the round $200 figure to restart the downtrend.
Litecoin Bounces at $1.50
Litecoin is in a similar boat as BTC, with the difference that instead of $250, the level to note is $1.50. On May 3rd prices got as high as $1.49 before pulling back. The next day we saw another push higher stop at $1.48. We are currently quoted at $1.4039.
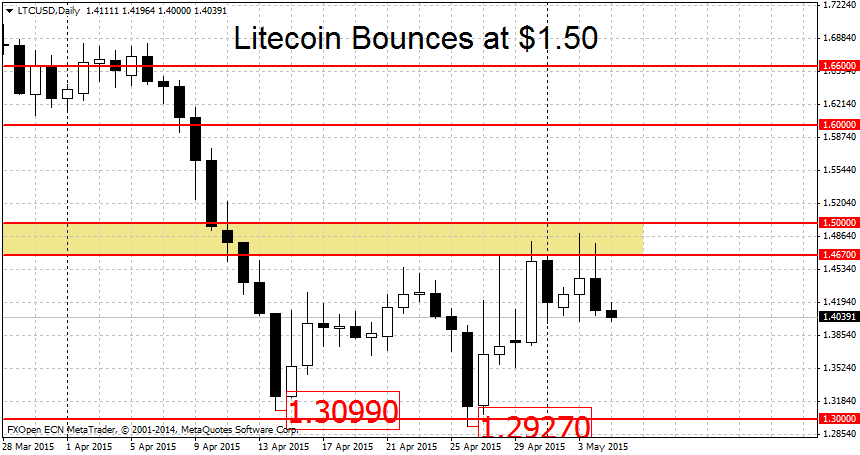
If we look at the chart above, we can see that LTC/USD exhibited very similar price action to bitcoin during the past few weeks. Both cryptocurrencies formed a double bottom, BTC near $210, LTC near $1.30. Then they both rallied substantially, bitcoin by 15 percent and 14 percent for Litecoin, before retracing some of these gains.
For Litecoin, the downtrend is over. But to spark a new rally, LTC/USD will need to clear the $1.50 level. If it does, the resistance levels to watch on the upside are $1.60 followed by $1.70. A clearing of this resistance area may propel LTC higher towards the March 23rd swing high near $1.80. On the lower end, the double bottom near $1.30 per coin should offer some support. A clearing of this area may resume the downtrend and lead to more losses toward this year’s low at $1.05.
FXOpen offers the world's most popular cryptocurrency CFDs*, including Bitcoin and Ethereum. Floating spreads, 1:2 leverage — at your service (additional fees may apply). Open your trading account now or learn more about crypto CFD trading with FXOpen.
*Important: At FXOpen UK, Cryptocurrency trading via CFDs is only available to our Professional clients. They are not available for trading by Retail clients. To find out more information about how this may affect you, please get in touch with our team.
This article represents the opinion of the Companies operating under the FXOpen brand only. It is not to be construed as an offer, solicitation, or recommendation with respect to products and services provided by the Companies operating under the FXOpen brand, nor is it to be considered financial advice.
Stay ahead of the market!
Subscribe now to our mailing list and receive the latest market news and insights delivered directly to your inbox.


Latest articles

US Dollar Index (DXY) Analysis: FX Markets Await Central Bank Decisions
Today, the focus for FX traders is on the Federal Reserve: at 21:00 GMT+3, the FOMC will announce its interest rate decision (rates are expected to remain unchanged), followed by a press conference with Fed Chair Jerome Powell

Market Analysis: EUR/USD Rebound Continues as USD/CHF Nears Key Inflection Point
EUR/USD is attempting a recovery wave from the 1.1400 zone. USD/CHF climbed higher above 0.7900 before it started a downside correction.
Important Takeaways for EUR/USD and USD/CHF Analysis Today
· The Euro declined toward 1.
BTC/USD Analysis: Bitcoin Price Reaches March High
Yesterday, BTC/USD rose above the $75k level, thereby setting a new high for March. The last time Bitcoin traded at such levels was in early February.
Why is Bitcoin Rising?
Bitcoin’s appeal appears to be increasing due to