Breakout or Bulls Trap? Gold Breaks Major Triangle Formation
Gold extended downside movement on Tuesday following a bearish inside bar breakout, breaking the daily triangle formation. A daily closing below the lower trendline of the triangle will validate a deeper correction towards the $1234 support area. The long term sentiment however remains positive due to Higher High in the recent upward rally.
Technical Analysis
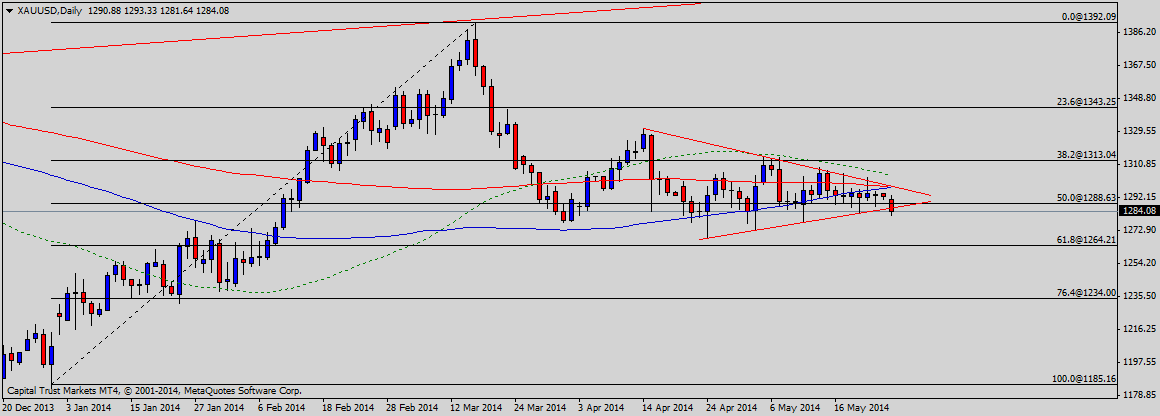
As of this writing, the precious metal is being traded near $1284. A hurdle may be noted around $1285, the trendline support turned resistance as demonstrated in the following chart ahead of $1297, the upper trendline of the triangle formation.
On the downside, the yellow metal is likely to find a support near $1264, the 61.8% fib level ahead of $1234, the 76.4% fib level. A break and daily closing below the $1234 support area could trigger a renewed selling pressure, opening doors for the double bottom support below the $1200 handle.
China Manufacturing
On Saturday, HSBC Holdings will release the Manufacturing Purchasing Managers Index (PMI) report of China—the largest consumer of the yellow metal. Since the Asian nation is an exports based economy so a manufacturing expansion indicates potential increase in the overall growth.
The Manufacturing PMI was seen standing at 50.4 points in the recent report, a higher reading on Saturday will be seen as bullish for the precious metal and vice versa. Generally speaking, a PMI reading above 50 shows expansion in the manufacturing activity while a reading below 50 signals contraction in manufacturing.
Conclusion
The Federal Open Market Committee (FOMC) minutes revealed last week that the policymakers were not in the favor of earlier than expected increase in the US interest rate which was seen as dovish for the US Dollar. So lose monetary policy in the US and China growth optimism may keep the price of gold supported in the near future. Buying or selling the metal on a daily closing above or below the triangle could be a good strategy.