


FXOpen

BTC/USD
From last Monday when the price of Bitcoin was sitting at $7805 at its lowest point we have seen an increase of 12.73% measured to the highest point made on Friday which was at $8805. Since then the price started decreasing again and is currently sitting at $8333 and is now moving sideways.
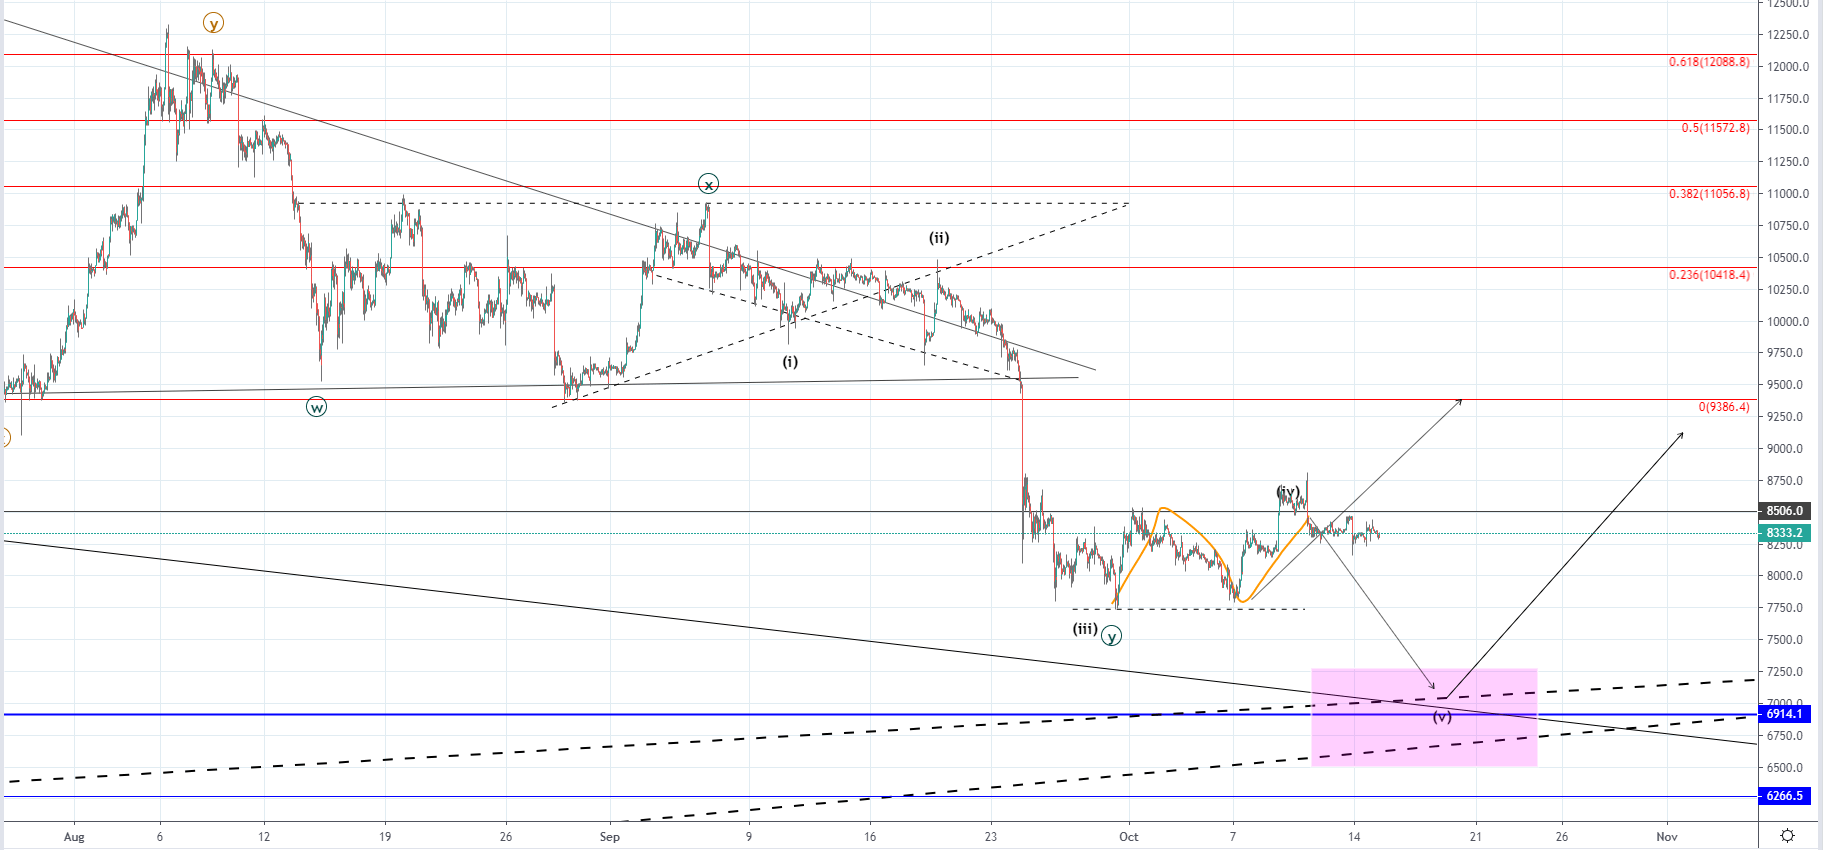 Looking at the hourly chart, you can see that the price attempted to move above the significant horizontal resistance level at $8500 but the attempt ended as a fakeout at least for now as the price quickly came back and in a matter of hours decreased by 5.57%. This decrease could be interpreted as a sign of the resistance found but we could see another attempt playing out as the price hasn’t gone below the prior low and is instead retesting the vicinity of the prior high’s ending point which is serving as support for now.
Considering that we are seeing the 3rd wave from the WXY correction to the downside we could be seeing the start of the expected recovery but if the price action is to complete its ending wave in a five-wave manner another lower low could be expected to around $7000 which is a significant support point.
If the price starts moving below the $8500 resistance with strong momentum it would serve as an early indication that the recovery has started, but if the price continues moving to the downside from here and goes below the prior low at around $7800 it would most likely mean that we are to see another lower low before the recovery.
XRP/USD
The price of Ripple has reached its significant horizontal resistance at $0.29405 today but is currently being traded below it as interaction ended as a rejection. From last Friday when the price was trading at $0.2659 we have seen an increase of 12.48% as the price has been developing its 5th wave to the upside.
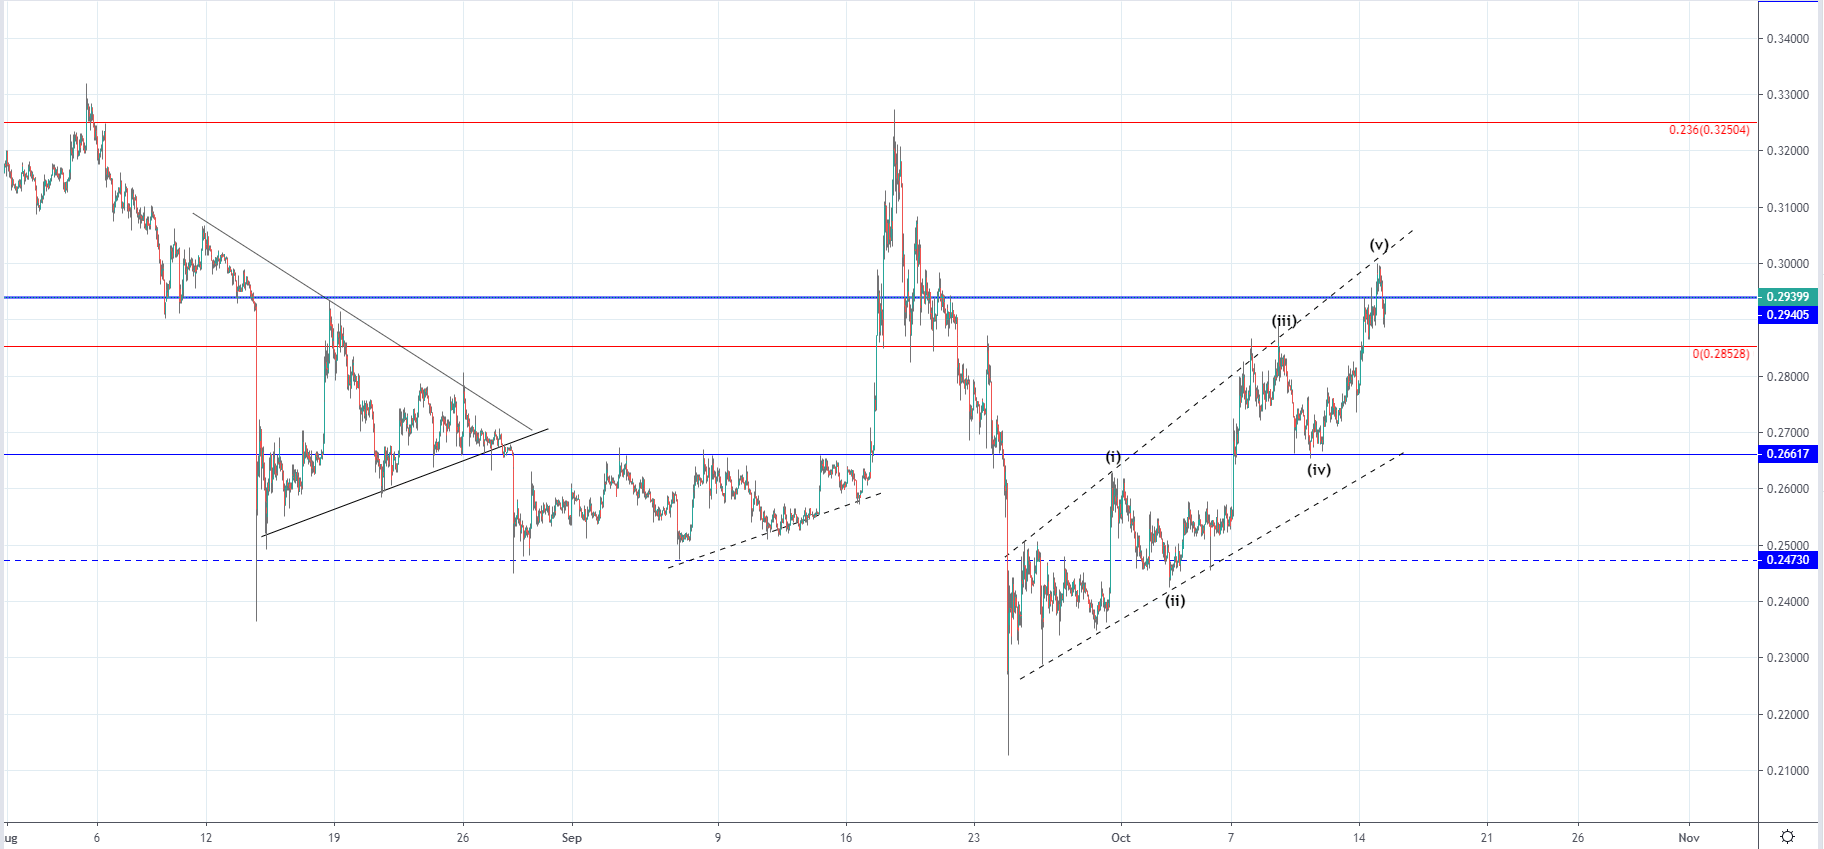 As you can see from the hourly chart the price has also reached the resistance intersection with the ascending channel which was formed from the 25th of September which is why now I would be expecting a retracement from which we are to see if the uptrend continuation would occurre or was this increase corrective in nature. This pattern shows a steep bullish trajectory but could also be corrective as prior to the decrease we have seen oversold conditions with the price dipping below the lower support level at $0.24744. Since the interaction with the most significant horizontal level has been made it is serving as pivot point above which the uptrend continuation looks likely, but below which downtrend continuation is probable.
FXOpen offers the world's most popular cryptocurrency CFDs*, including Bitcoin and Ethereum. Floating spreads, 1:2 leverage — at your service. Open your trading account now or learn more about crypto CFD trading with FXOpen.
*Important: At FXOpen UK, Cryptocurrency trading via CFDs is only available to our Professional clients. They are not available for trading by Retail clients. To find out more information about how this may affect you, please get in touch with our team.
This article represents the opinion of the Companies operating under the FXOpen brand only. It is not to be construed as an offer, solicitation, or recommendation with respect to products and services provided by the Companies operating under the FXOpen brand, nor is it to be considered financial advice.
Stay ahead of the market!
Subscribe now to our mailing list and receive the latest market news and insights delivered directly to your inbox.


Latest articles

S&P 500 Index: Chart Analysis After Friday’s Sell-Off
Trading on 12 December was overshadowed by a sharp decline in the S&P 500 (US SPX 500 mini on FXOpen), with the session low approaching December’s previous trough.
Among the key fundamental drivers behind Friday’s drop

Market Analysis: AUD/USD and NZD/USD Test Support, Break or Bounce Next?
AUD/USD is attempting a fresh increase from 0.6630. NZD/USD is consolidating and could aim for a move above 0.5800 in the short term.
Important Takeaways for AUD/USD and NZD/USD Analysis Today
· The Aussie Dollar

USD/JPY Slides Towards Key Support
A Bank of Japan monetary policy meeting is due this week, and expectations around the decision are supporting the yen today. Traders increasingly believe that the central bank may raise its policy rate by 25 basis points to 0.75%