BTC and XRP - Are we seeing the start of the recovery?
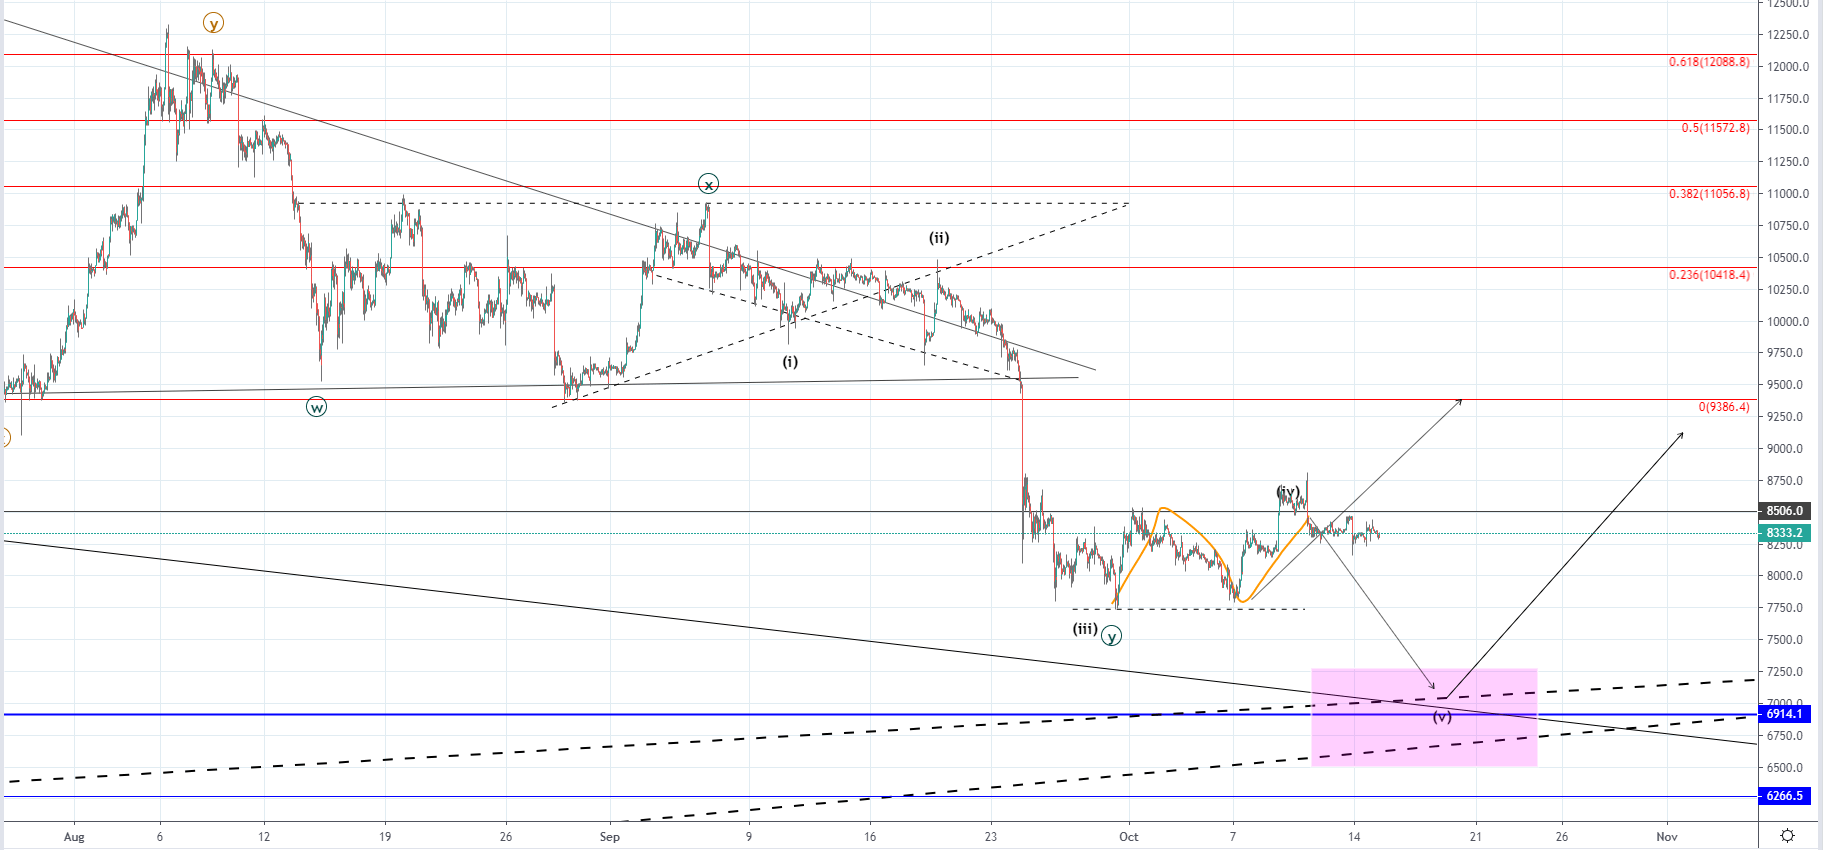
BTC/USD
From last Monday when the price of Bitcoin was sitting at $7805 at its lowest point we have seen an increase of 12.73% measured to the highest point made on Friday which was at $8805. Since then the price started decreasing again and is currently sitting at $8333 and is now moving sideways.
Considering that we are seeing the 3rd wave from the WXY correction to the downside we could be seeing the start of the expected recovery but if the price action is to complete its ending wave in a five-wave manner another lower low could be expected to around $7000 which is a significant support point.
If the price starts moving below the $8500 resistance with strong momentum it would serve as an early indication that the recovery has started, but if the price continues moving to the downside from here and goes below the prior low at around $7800 it would most likely mean that we are to see another lower low before the recovery.
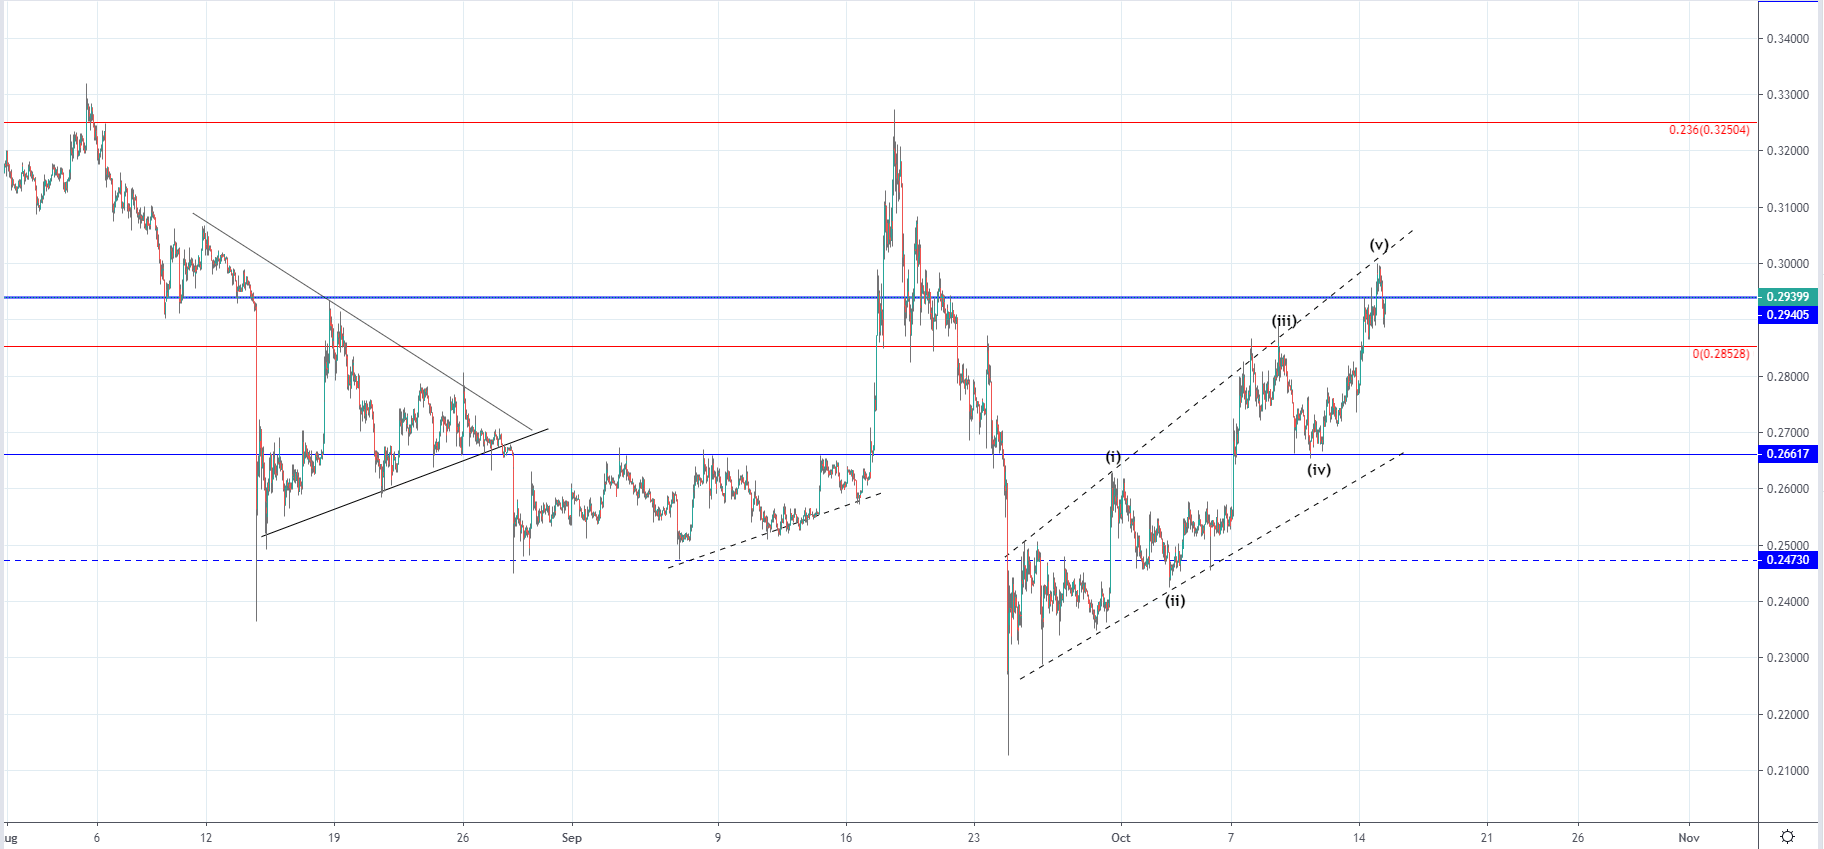
XRP/USD
The price of Ripple has reached its significant horizontal resistance at $0.29405 today but is currently being traded below it as interaction ended as a rejection. From last Friday when the price was trading at $0.2659 we have seen an increase of 12.48% as the price has been developing its 5th wave to the upside.