BTC and XRP - Breakout Or A Fakeout?
BTC/USD
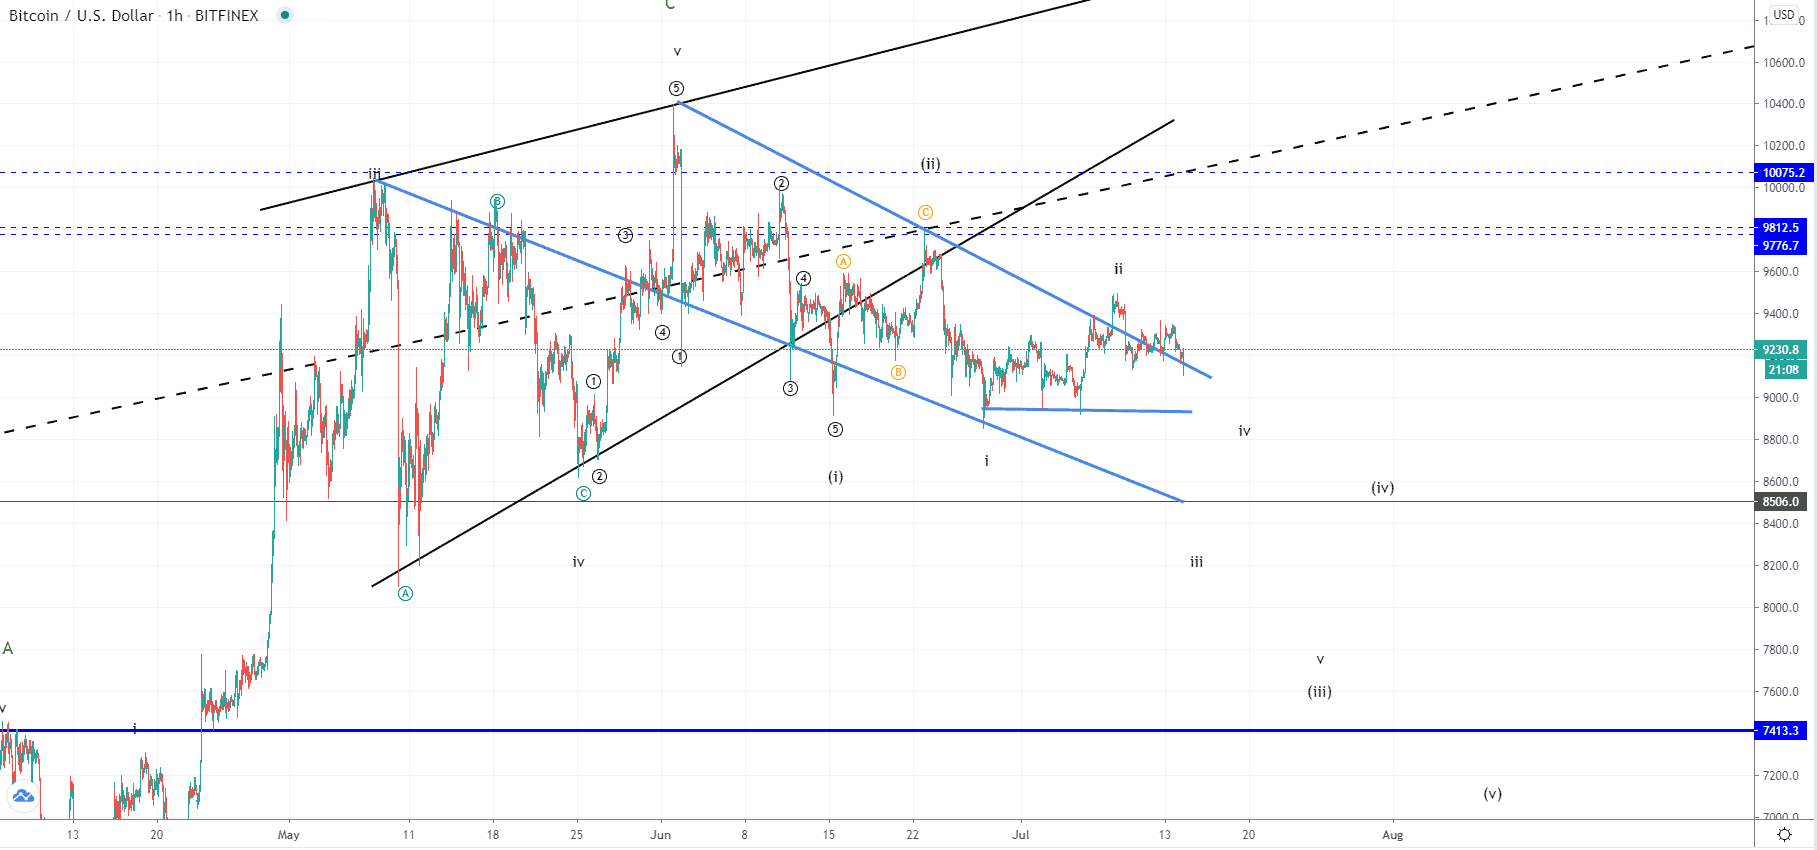
From last week’s high made on Wednesday at $9489, the price of Bitcoin has decreased by 4% measured to today’s low at $9109.9. Currently, the price is being traded at $9230 as a minor recovery has been made but is overall in a downward trajectory.
This indicates bullishness as the buyer’s pressure pushed the price back above the significant level validating the support, but since the level is still being tested we are yet to see if it holds or are we to see another fakeout. The wave structure implies that further downside should be expected from the current levels as we have most likely seen a corrective wave to the upside. If however, the price continues increasing from here as it finds support and goes above the last week’s high the count would be invalidated as we have seen the development of a five-wave impulse instead of the three-wave correction to the upside.
XRP/USD
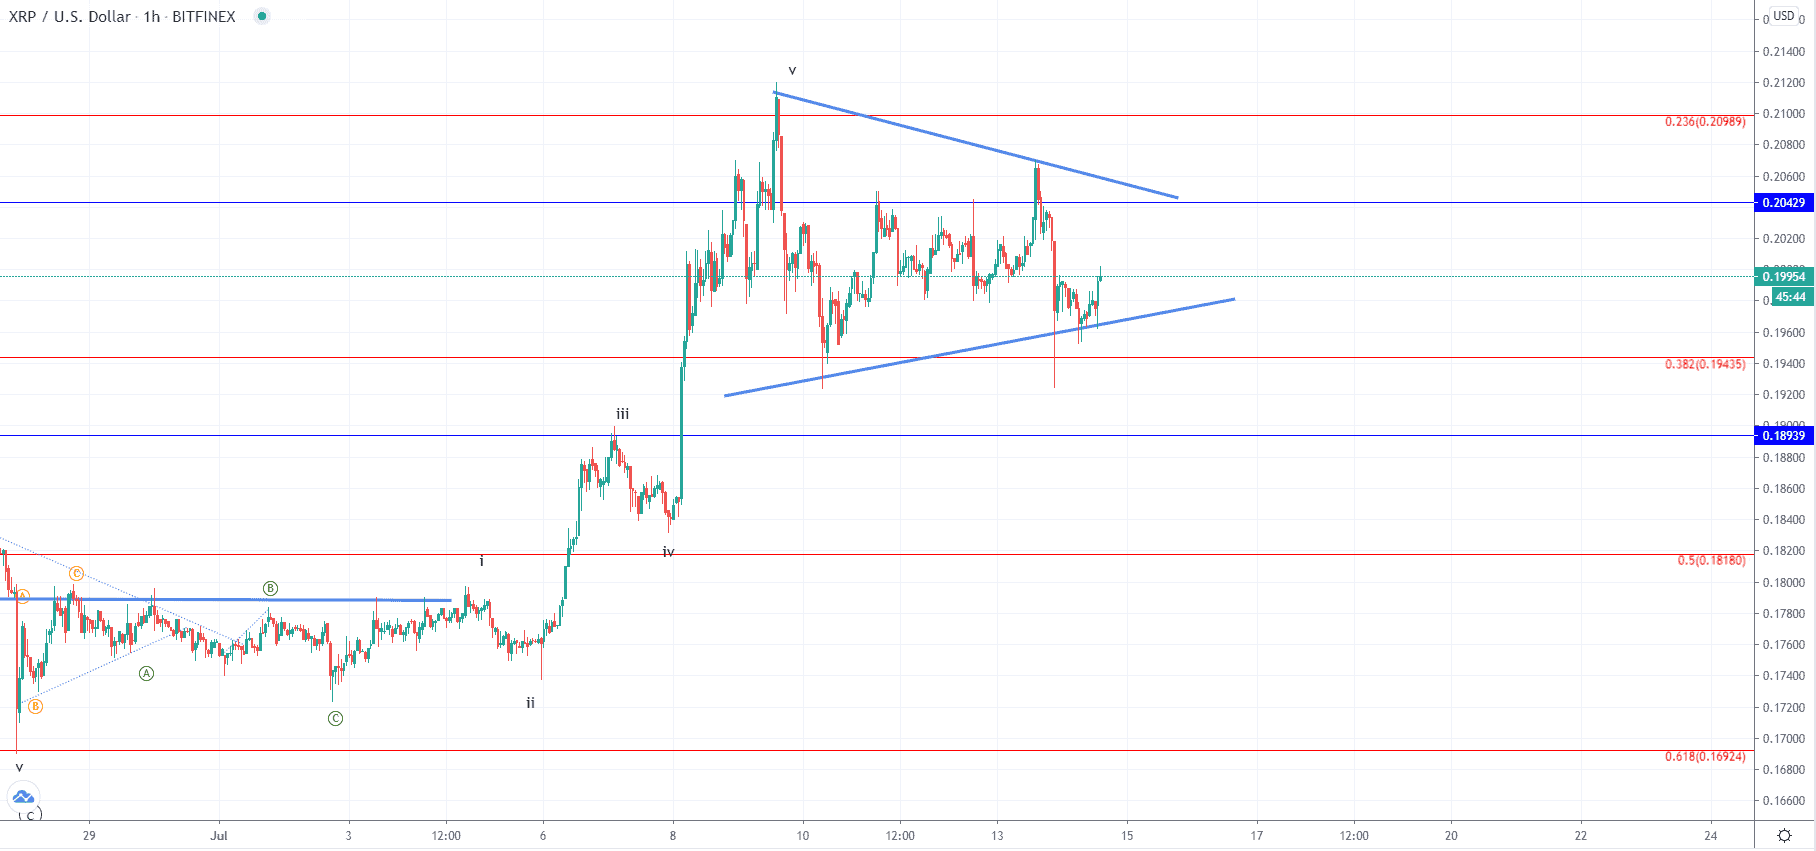
The price of Ripple has continued increasing from our last projection making the prior count invalidated but it appears that we have seen the completion of the 5th wave to the upside and the end of the impulsive increase after which a symmetrical triangle started forming. Yesterday the price came up to establish the resistance level from the symmetrical triangle and after a test, we have seen a rejection pushing the price for a 5.51% decrease coming from $0.20693 to $0.19553 at its lowest point today. At the moment the price is hovering just slightly below the $0.2 mark and is in an upward trajectory.
If this is true then further upside movement could be seen as the corrective structure develops fully, potentially retesting the triangle’s resistance once more before we can see a proper breakout to the downside.