BTC and XRP - Breakout to be expected shortly, but from which side?
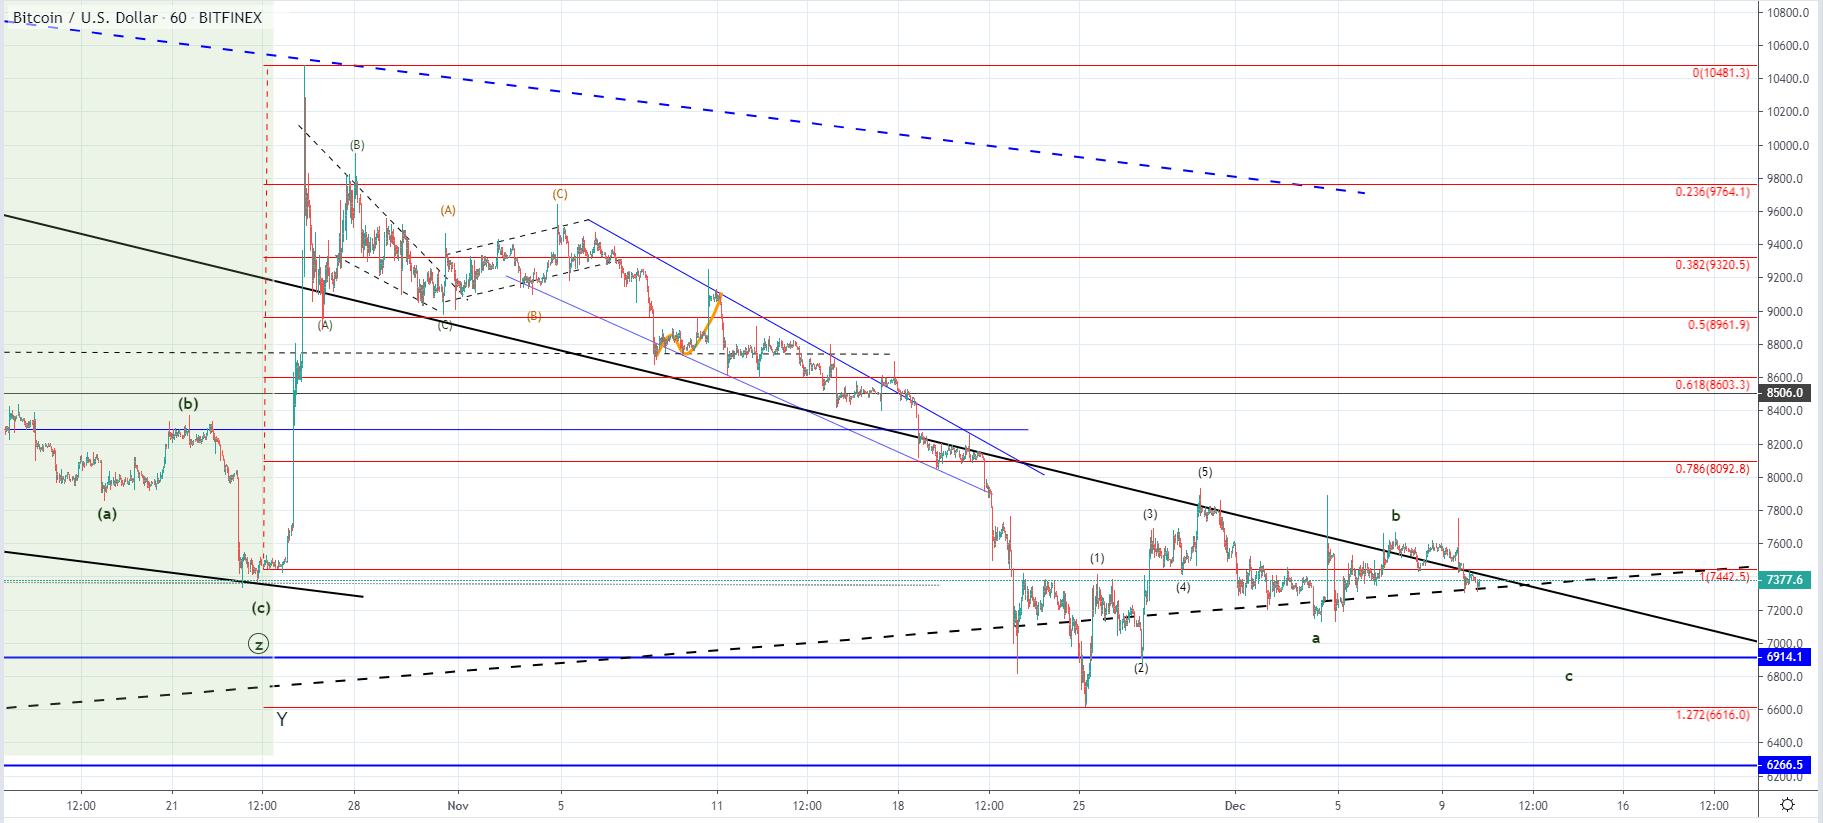
BTC/USD
From yesterday’s high at $7592 the price of Bitcoin has decreased by 3.55% as it came down to $7322 at its lowest point today. It’s currently being traded at $7377 which is slightly higher with the price being stuck in a resistance range.
The interrupted ascending trendline dates back from February when the next wave to the upside started and served as the first baseline support from the move to the upside. The level has been pierced on the 25th of November when the price spiked to the 1.272 Fibonacci level but this resulted in a strong buying activity as the price came back to retest the descending channels resistance. The price increase was made in a five-wave manner which indicates impulsiveness which was expected to start as the previous downfall most likely ended on the Fib level interaction.
If this is true the currently seen structure could be a three-wave correction which is why another move to the downside could be expected from here to the $6914 horizontal support before further movement to the upside continues.
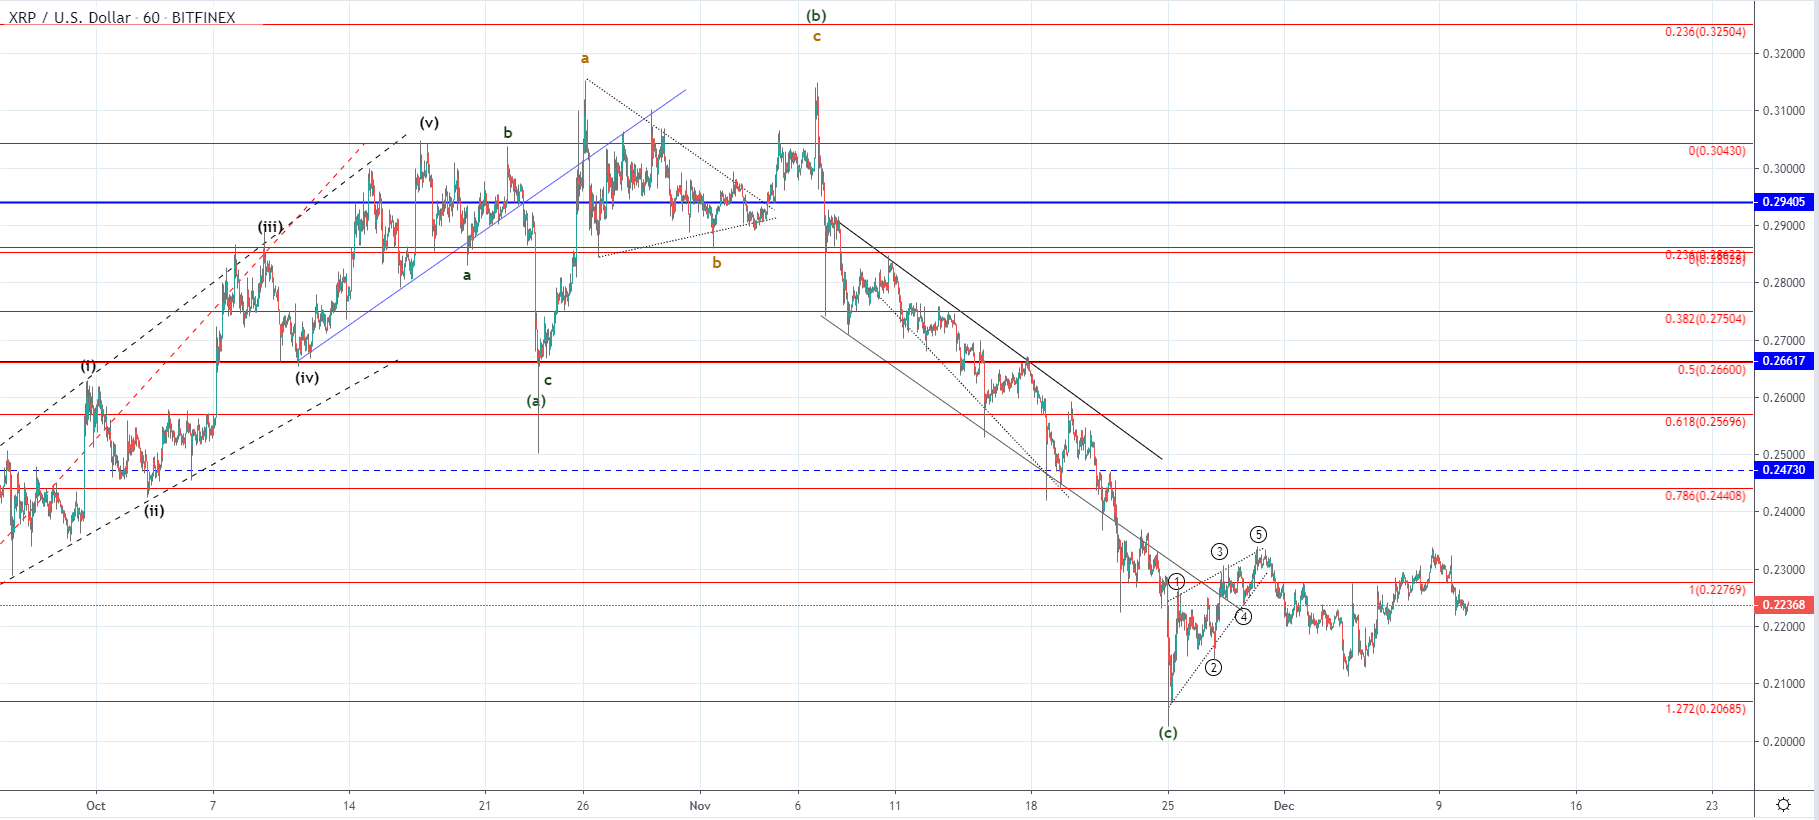
XRP/USD
The price of Ripple has decreased by 4.4% from yesterday’s open at $0.23235 as it came down to $0.22215 at its lowest point today. Last week on Thursday a minor recovery has started and pushed the price above the 1 Fib level but since then a minor retracement has been made below it. This could be an early indication that the price decrease would continue further as the level hasn’t served as support.
On the hourly chart, you can see that the price of Ripple moved sideways since the interaction with the 1.272 Fibonacci level and reached a prior high level without surprising it before another downturn started. As the price made an ascending triangle on the previous increase and then went on to decrease on a higher low this could be the start of the 3rd wave to the upside out of which we are seeing the 1st sub-wave.
But more likely, since the last increase looks choppy and corrective we have seen a three-wave sideways move which is another correction before further lower lows. If this is true then this could be the 4th structure out of the wxyxz correction of a higher degree which would mean that the price of Ripple is headed further to the downside as the Z wave should develop fully. This will be validated but the depth of the current retracement as well as the momentum of the next move to the upside.