


BTC and XRP - Bullish Action Likely To Continue
FXOpen

BTC/USD
The price of Bitcoin has been continuing to increase in the previous period and came from last week’s low at $10954 made on Monday to $12063 at its highest point made yesterday which was an increase of 10.12% in the seven days. As the price reached the vicinity of its prior high and started interacting with the significant seller’s territory another retracement has been seen with the price currently being traded at $11746.
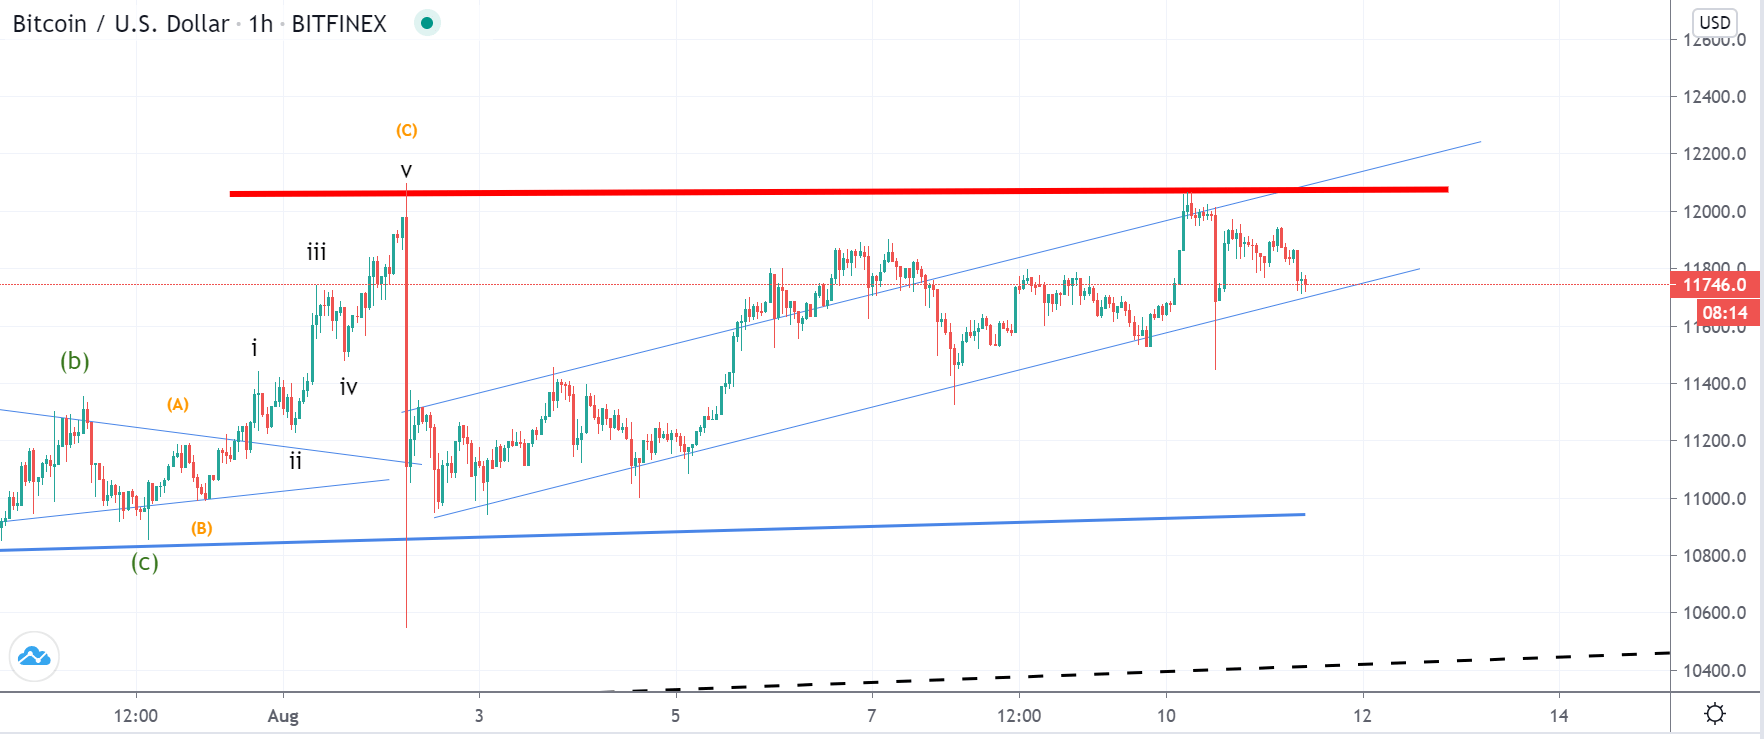
On the hourly chart, you can see that from last Monday we have seen the formation of another ascending channel in which the price has moved to the upside in a five-wave manner. This is why our previous count has been invalidated in which we have seen the formation of the 2nd corrective wave to the downside and another third was anticipated to start impulsively bringing the price of Bitcoin significantly lower.
This scenario might still be in play if this move to the upside was made in a three-wave manner as the 2nd wave out of the corrective count could bring the price to its point of origin, but since the price pathway looks more like it formed in a five-wave manner instead, it could indicate that another bullish upside move is to be anticipated.
If this is true then the price of Bitcoin is to break out to the upside above its significant horizontal resistance and can be set into an upward trajectory into another parabolic move as if manages to break it there isn’t any significant resistance until $15700 area.
XRP/USD
Last week the price of Ripple has decreased by 11.39% coming from its Mondays high at $0.3189 to its lowest point at $0.2826 made on Sunday. Since then recovery has been made above the $0.3 mark but with the price currently being traded slightly below it at around $0.2982.
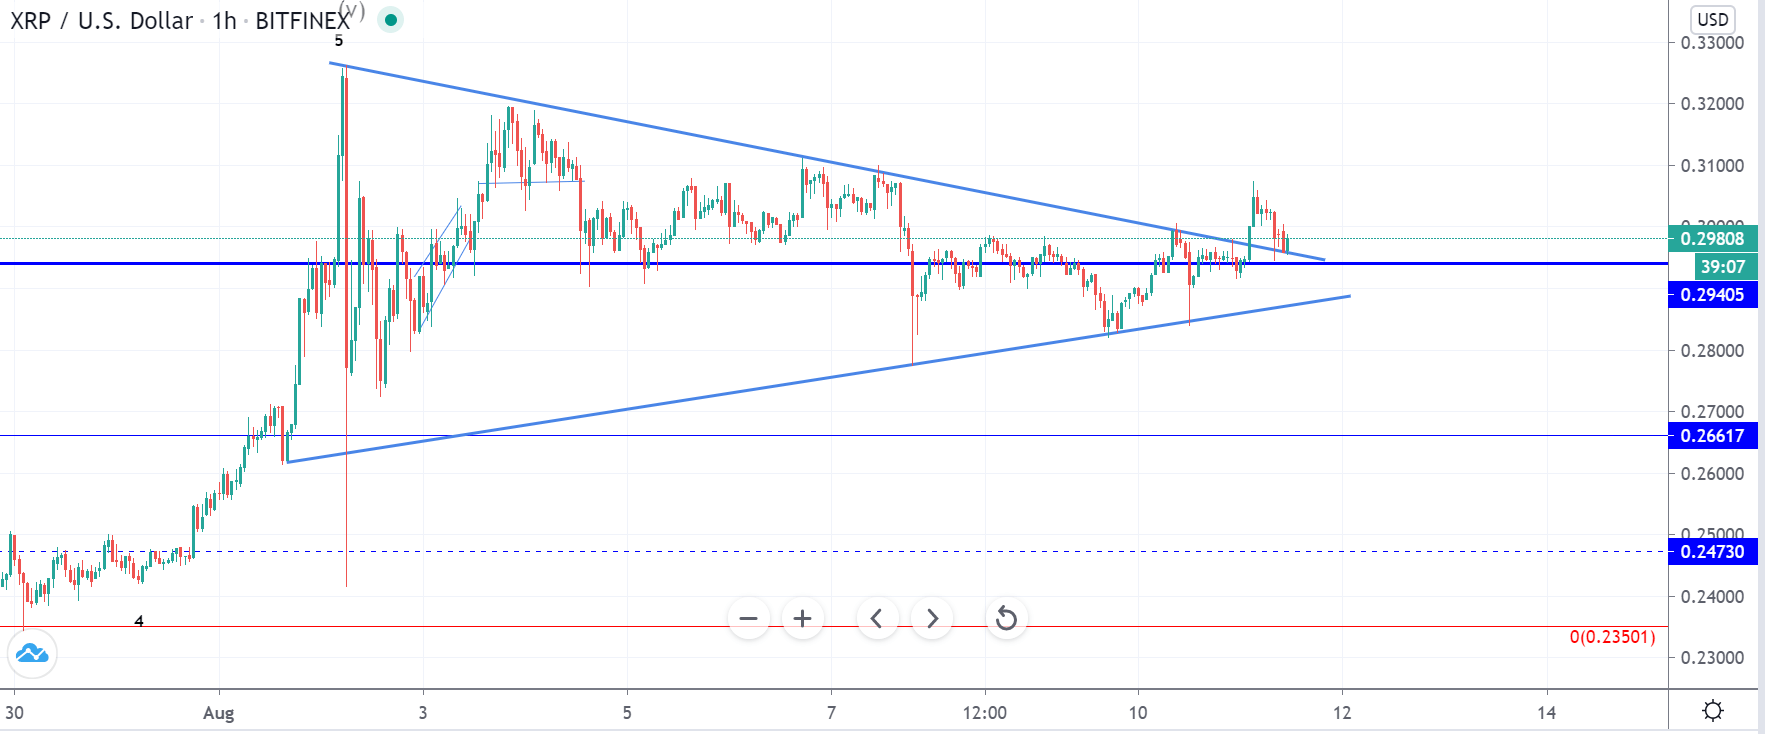
On the hourly chart, you can see that a symmetrical triangle formed since the completion of the 5th wave on the 2nd of August when an impulsive move to the downside was seen with a large spike that pushed the price below $0.2473 level. From yesterday we have started seeing a breakout on the upside from the mentioned triangle and the price fell back to its resistance level to retest it for support.
As it appears that the support has been validated indicated buy the current green candle we are likely to see a breakout continuation with the price of Ripple starting to form another five-wave move to the upside.
FXOpen offers the world's most popular cryptocurrency CFDs*, including Bitcoin and Ethereum. Floating spreads, 1:2 leverage — at your service (additional fees may apply). Open your trading account now or learn more about crypto CFD trading with FXOpen.
*Important: At FXOpen UK, Cryptocurrency trading via CFDs is only available to our Professional clients. They are not available for trading by Retail clients. To find out more information about how this may affect you, please get in touch with our team.
This article represents the opinion of the Companies operating under the FXOpen brand only. It is not to be construed as an offer, solicitation, or recommendation with respect to products and services provided by the Companies operating under the FXOpen brand, nor is it to be considered financial advice.
Stay ahead of the market!
Subscribe now to our mailing list and receive the latest market news and insights delivered directly to your inbox.


Latest articles

EUR/USD Eyes Gains As USD/CHF Weakness Deepens Again
EUR/USD started a fresh increase above 1.1700 and 1.1720. USD/CHF declined further and is now struggling below 0.7835.
Important Takeaways for EUR/USD and USD/CHF Analysis Today
· The Euro started a decent increase from

Apple: Earnings Day Above the Activity Zone
On 30 April, after the market close, Apple Inc. will release its financial results for the second quarter of fiscal 2026. The consensus forecast, based on estimates from 31 analysts, points to revenue of around $109.7 billion, with expected

USD/JPY and USD/CHF Near Key Levels: The Dollar Supported by the Fed
The US dollar continues to trend upwards following the Federal Reserve meeting, drawing support from the regulator’s moderately hawkish stance and comments by Jerome Powell. Markets interpret the Fed’s rhetoric as a signal that restrictive policy is likely