BTC and XRP - Bullish price action is likely to continue
BTC/USD
From last week’s low at $7367 the price of Bitcoin increased by 42.44% spiking to $10494 at its highest point on Saturday. Since then we have seen a retracement developing with the price currently being at its median point at around $9500.
Looking at the wave structure we can see that the previous increase ended as a five-wave move to the upside. As this was an impulsive move the current structure is viewed as a retracement. Since the ending point of the last week’s spike, we have seen a five-wave move to the downside followed by a three-wave increase. This looks like the development of an ABC move to the downside which would mean that another 12345 move should develop.
I have already counted a five-wave move of the third wave but I believe that its the one of the lower degree count which means that further lows would be expected. There could be a possibility that the ABC correction ended in which case we will see a breakout to the upside above the triangle’s resistance which can serve as a pivot point.
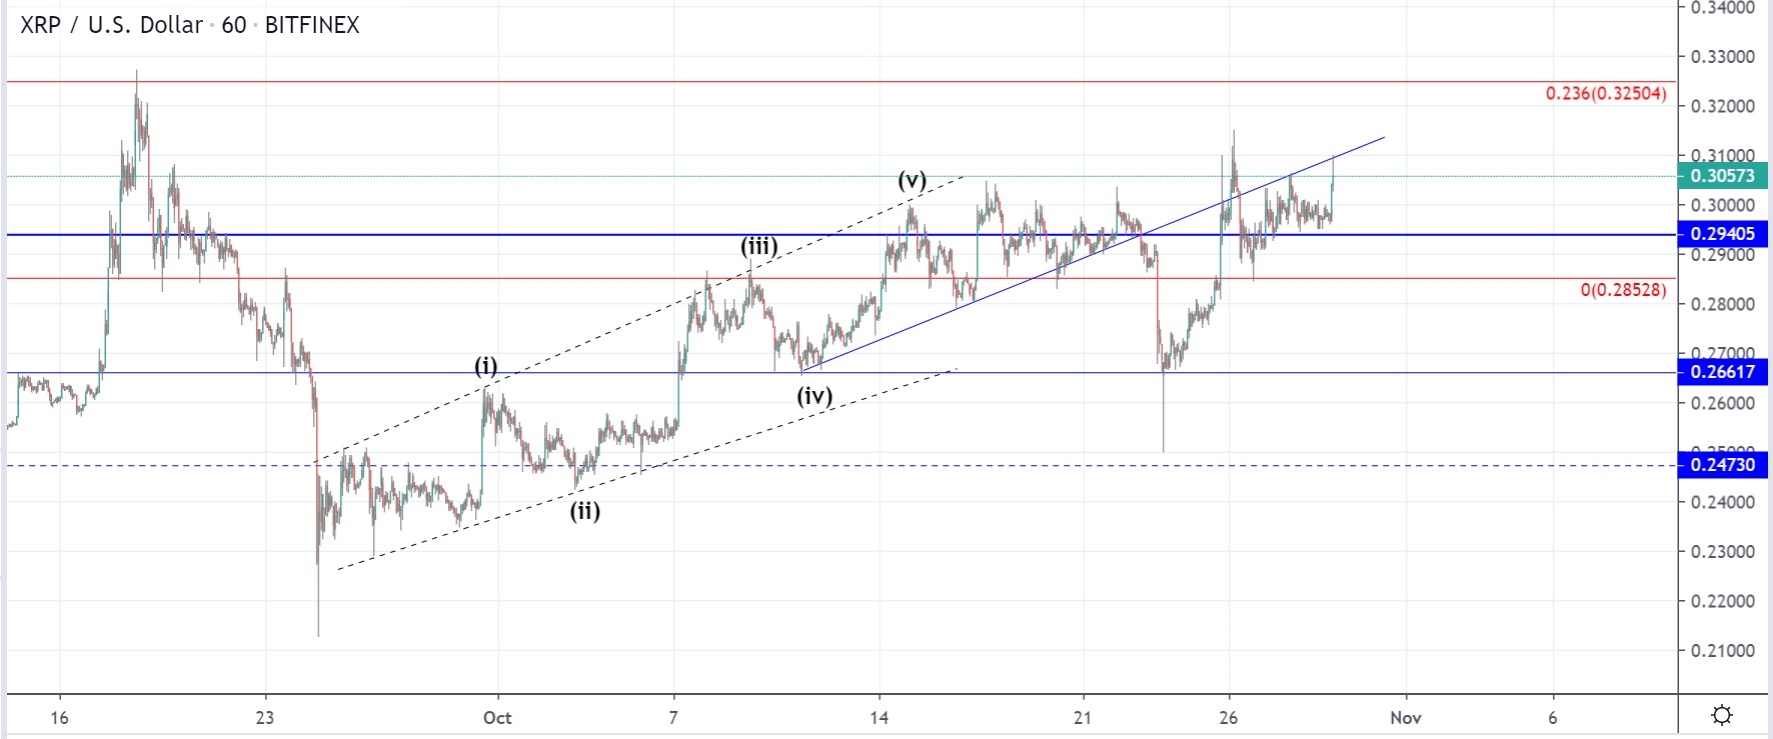
XRP/USD
The price of Ripple has today interacted with the ascending trendline which served as support but now serves as resistance which is why the interaction ended as a rejection.
As you can see from the hourly chart, after a retest of the $0.26617 significant level which served as support the price spiked up again above the most significant one at $0.29405 on Friday and was retesting it throughout the following days.
Another upside move started but as the price found resistance at the prior support a retracement back the horizontal support level could look likely. Previously we have seen an ascending channel to the upside in which a five-wave structure developed, and the downfall to the $0.26617 level was in a three-wave manner.
This could be interpreted as the first two waves from the starting 12345 move to the upside in which case the increase we have seen from the $0.266 level would be the first sub-wave of the 3rd wave from the higher degree.
If this is true then upside trend continuation should occur shorty with strong bullish momentum as the 3rd wave is usually the most decisive one.