BTC and XRP - Bullishness Seen But For How Long?
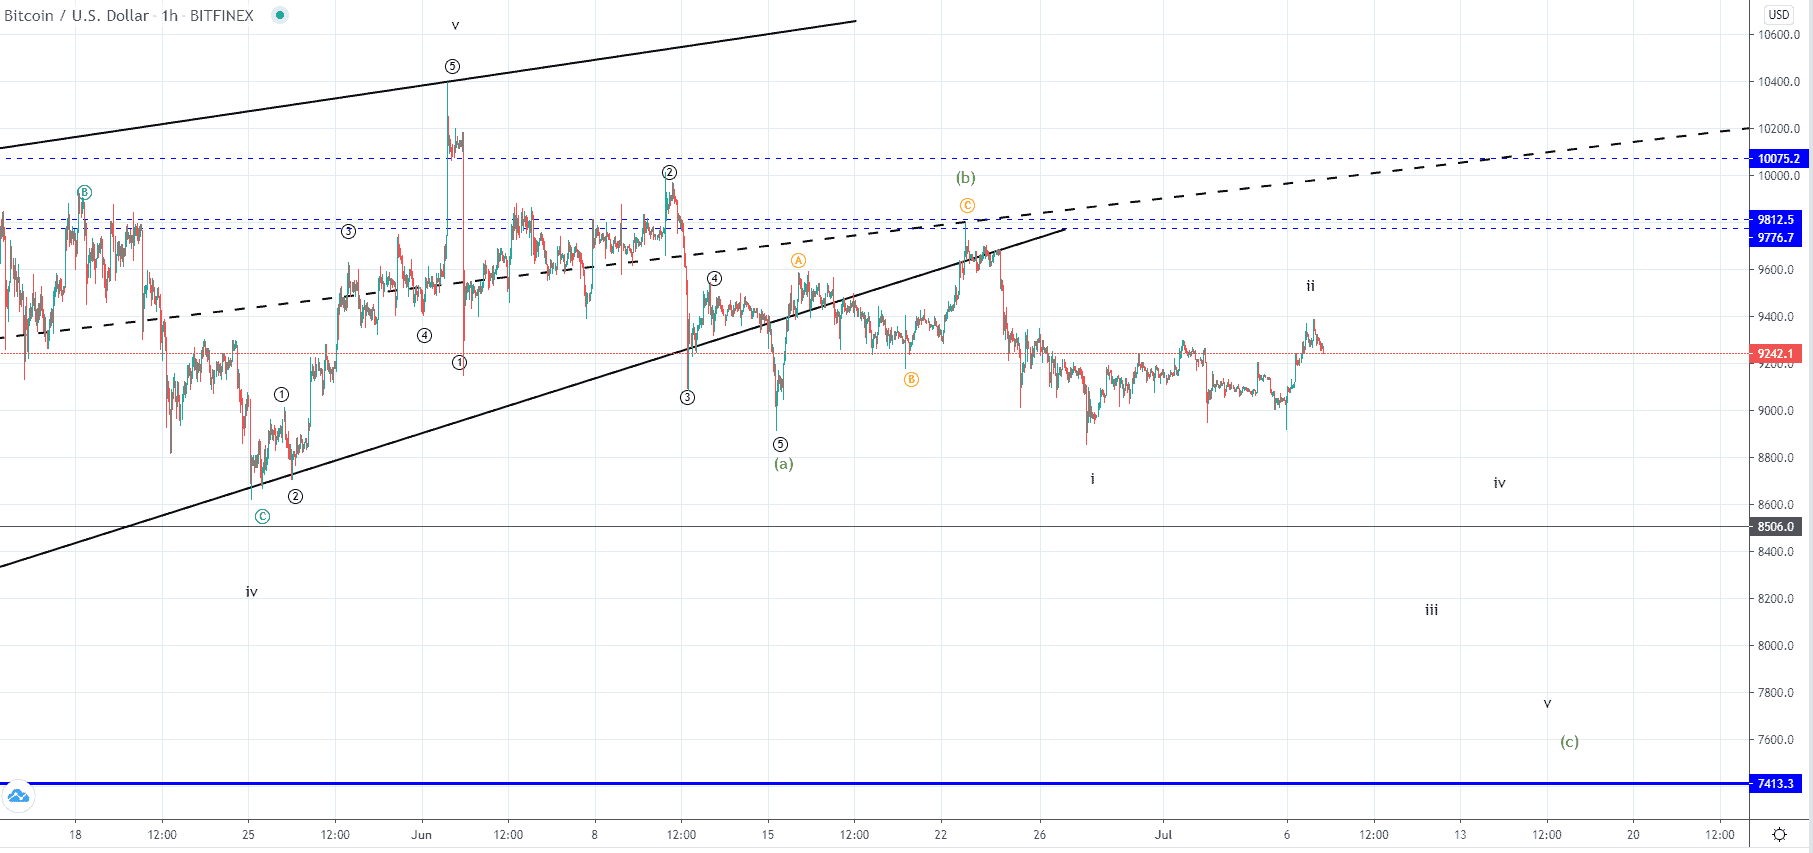
BTC/USD
From yesterday’s open when the price of Bitcoin was sitting at $9021, we have seen an increase of 4% as it came up to $9383 at its highest point today. We have seen a minor pullback after with the price currently being traded at around $9242 and is in a downward trajectory.
If the price manages to stay above the level and finds support there we are likely to see further uptrend continuation but not above $9700 or it would invalidate the current count. But if we see a straight decline which I believe is more likely the bearish count in which we are seeing an impulsive five-wave structure to the downside developing would be confirmed.
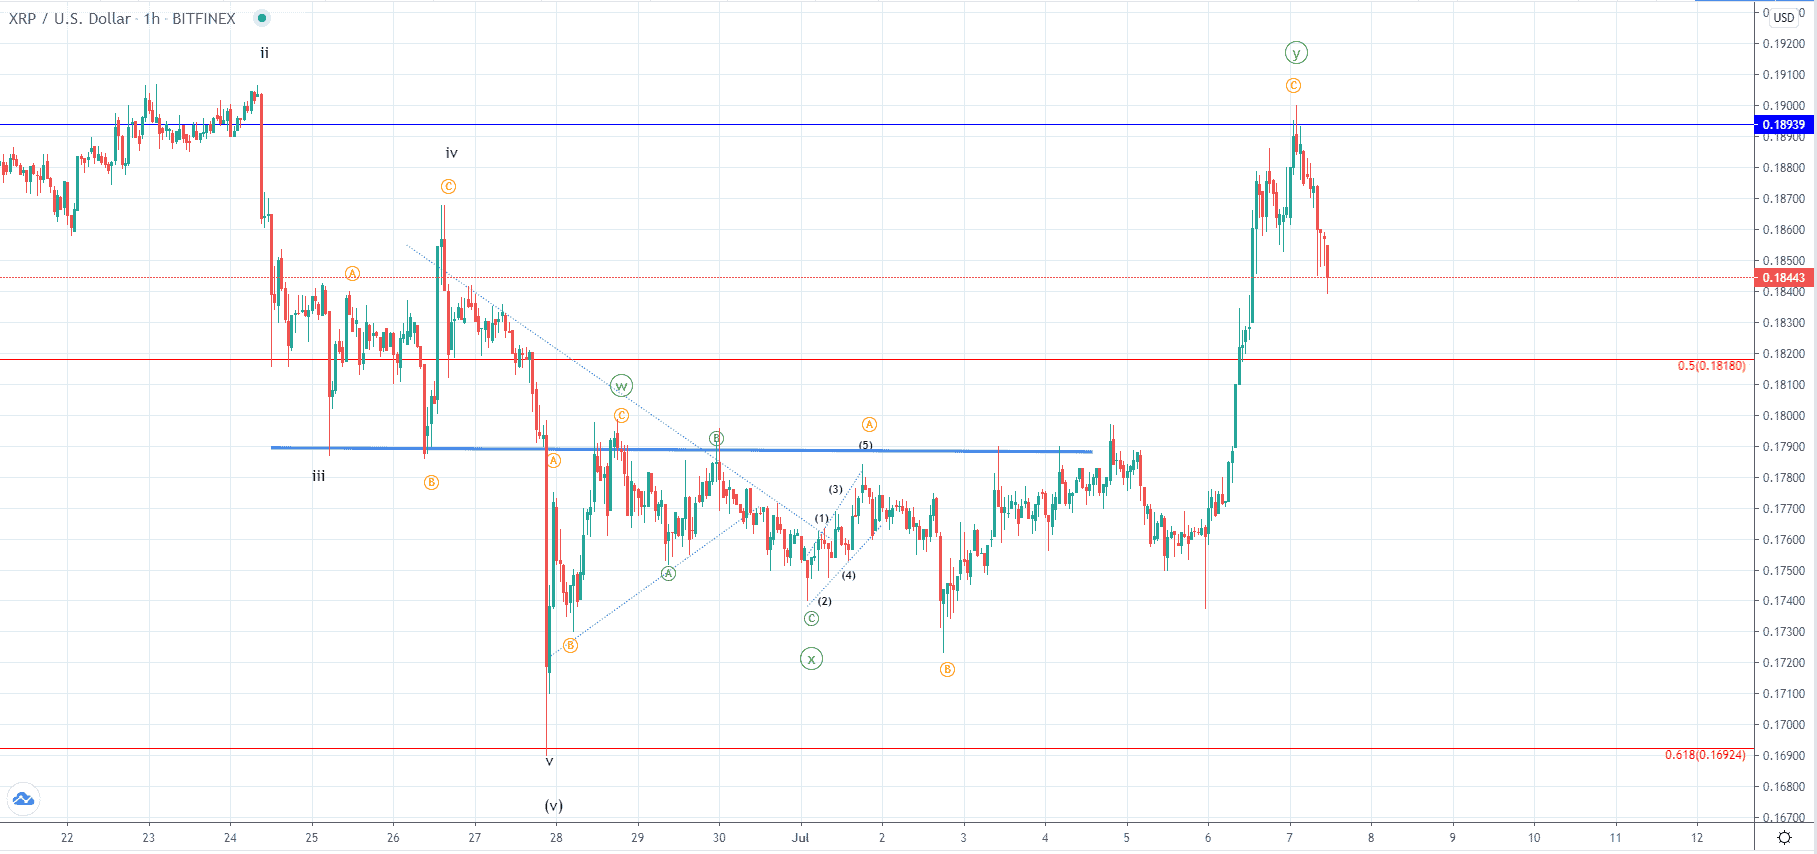
XRP/USD
The price of Ripple spiked significantly to the upside as from Sunday’s low at $0.175 we have seen an increase of 8.33% with the price reaching $0.18977 significant horizontal level and spiked even a bit further above the $0.19 mark. As it entered the upper range where the seller’s territory is a round of sell-off has been activated and the price has declined by around 3.1% since and is sitting at $0.184 at the moment.
The price is now like in the case of Bitcoin falling down to retest it’s broken resistance for support and if the support is present we are likely to see further upside continuation but if the Y wave of a higher degree has ended we could be seeing the price moving straight to the downside as a new downtrend develops.