BTC and XRP - Correction developing
BTC/USD
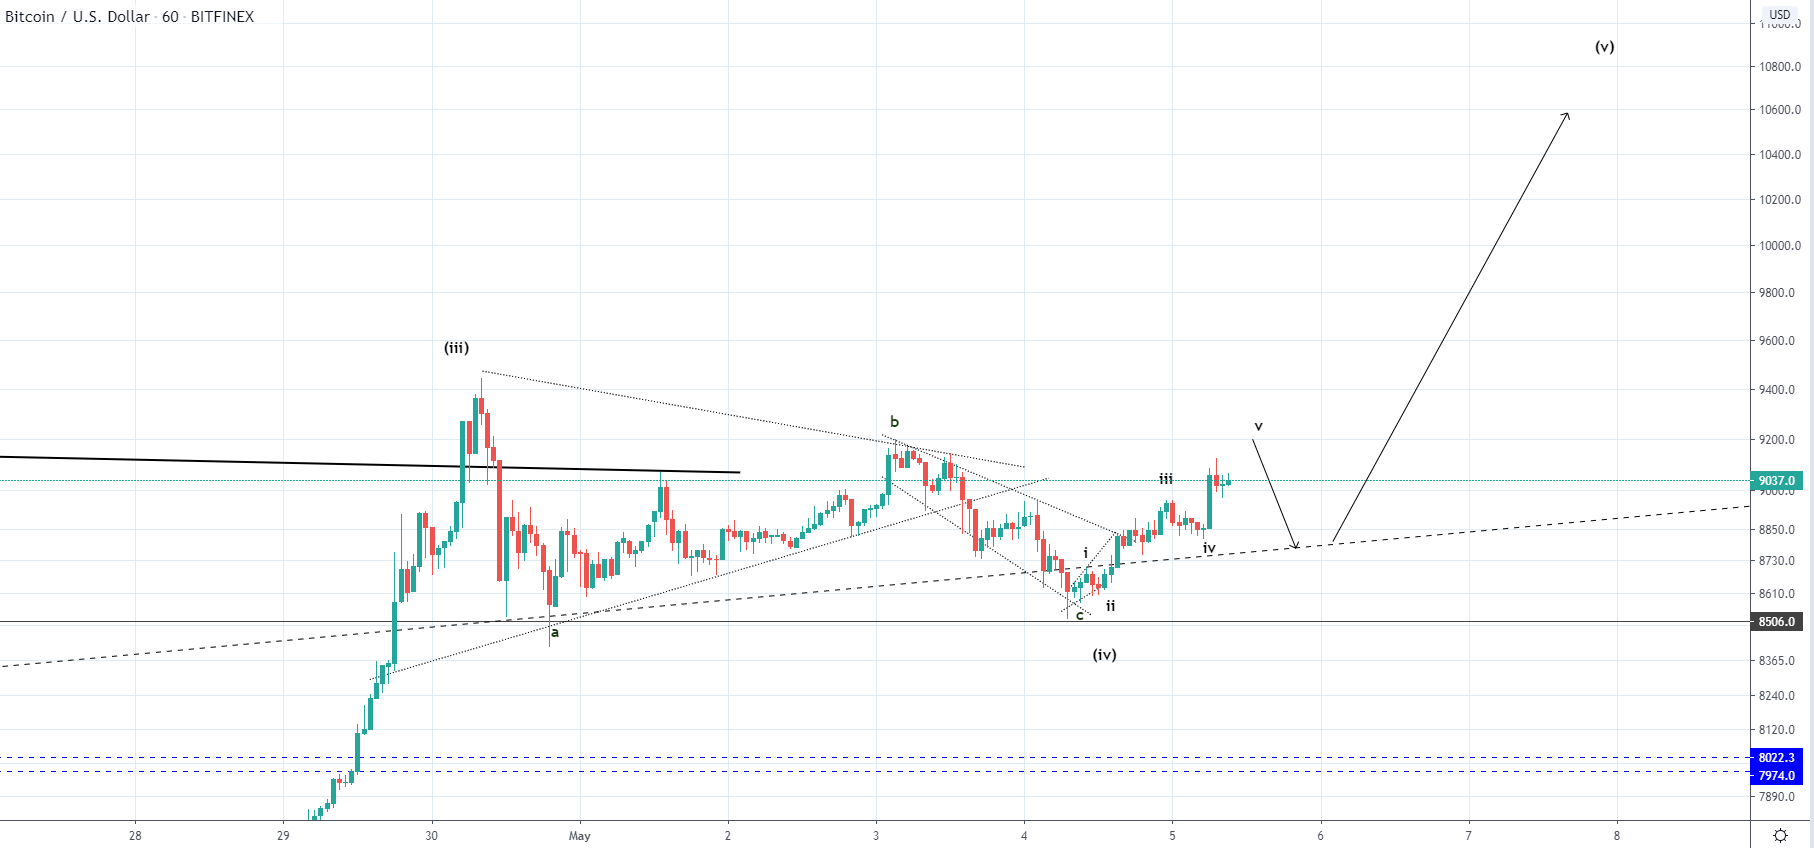
From last Monday when the price of Bitcoin was sitting on $7580 at it’s lowest point we have seen an increase of 24.61% as it came to $9445 on Thursday. Since then we have seen the price in a retracement which was further developed as a sideways range. Yesterday the price came down close to the vicinity of the prior low and to $8523 at it’s lowest from where we have seen another increase of around 7% coming to $9128 but is currently being traded at around $9000.
This triangle is most likely the 3rd wave to the upside from the higher degree five-wave impulse in which case the current upside move could be the start of the next one to the upside and would be its 1st sub-wave. If that is true then from last week’s high we have seen the completion of the ABC correction but another possibility could be that it is to be prolonged by 2 more waves.
If we see a retracement back to the interrupted ascending trendline where the price finds support and continues increasing impulsively again it would most likely indicate a proper breakout from the current range and the development of the 5th wave to the upside. But if the price continues moving to the vicinity of the prior low further sideways action could be seen before the uptrend continues.
XRP/USD
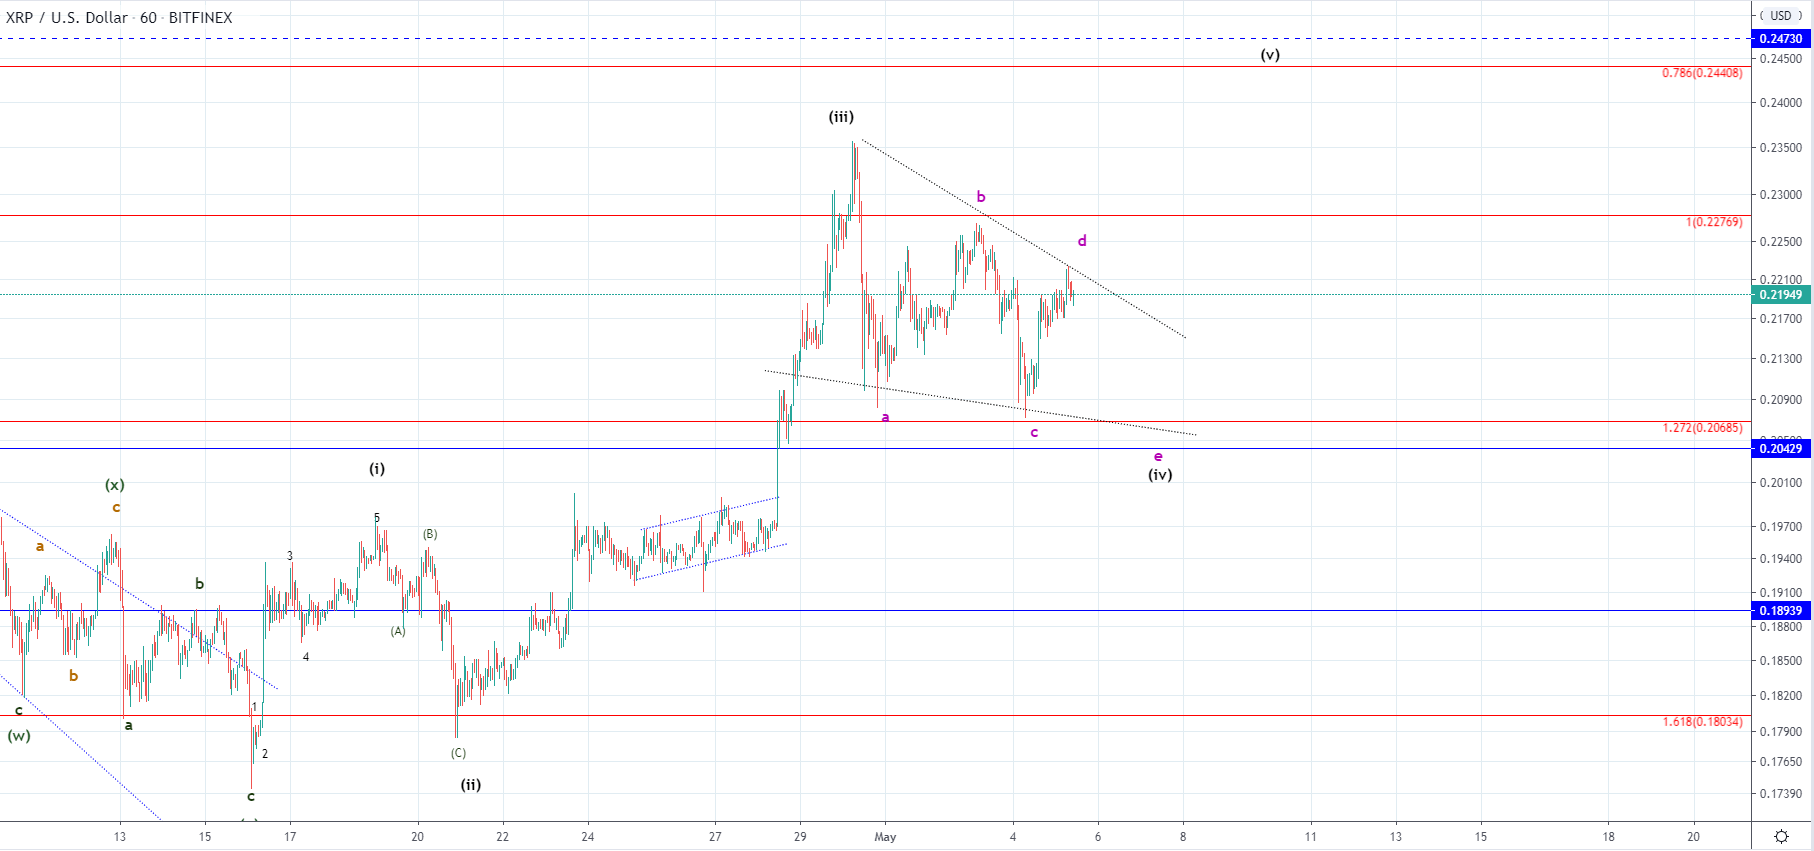
The price of Ripple has been following the same pattern as in the case of Bitcoin as we have seen an increase of 21.3% as it came up to $0.2357 on last Thursday from where we have seen the formation of the corrective triangle.
This is why I would be expecting another lower low before a breakout to the upside for the uptrend continuation potentially at the 0.786 Fib level which would bring the price of Ripple to $0.244.