BTC and XRP — Correction or Long-Term Downtrend Developing?
BTC/USD
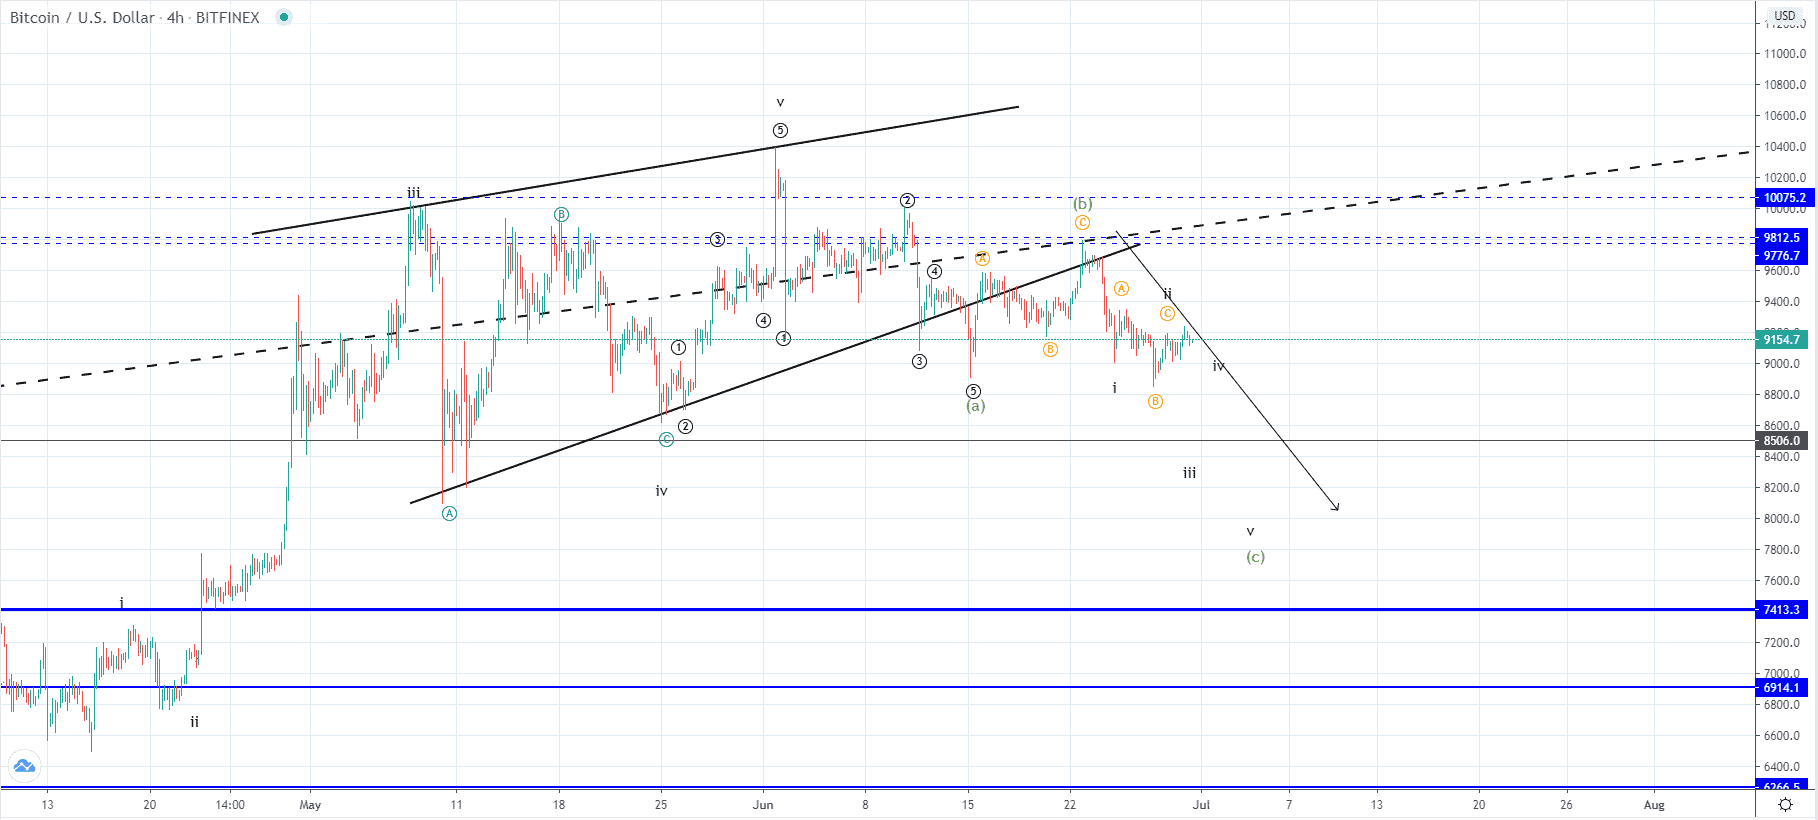
From last Monday when the price of Bitcoin was sitting around $9783 at its highest point we have seen a decrease of 9.57% measured to its lowest point made on Saturday at $8847. Since then we have seen a recovery of 3.93% coming to $9221.7 with the price now being traded slightly lower.
Looking at the hourly chart, you can see that the projection is going in accordance as I have outlined the price pathway in the previous post to be a move to the downside as we have seen a test of the ascending triangle's support level for resistance after a breakout below it. This was appeared to be an ABC correction to the upside which is why now I would be expecting to see another five-wave impulse to the downside which could either be a C wave if this structure is corrective or the 3rd wave if this structure from the 1st of Jun is impulsive.
The price made an interaction with the ascending triangle’s resistance level on the 1st of Jun coming to $10402 at its highest spike after which a downward impulse has been seen below the starting point of the prior upside move which indicated the end of the increase. If this move marked the completion of the higher degree C wave out of the ABC correction that developed since the 16th of March then we are likely seeing the development of a sustainable downtrend out of which the now expected five-wave move would be the 3rd sub-wave of the 1st wave from the higher degree. But in either way from the depth and the momentum from the decline, we are to evaluate this possibility.
XRP/USD
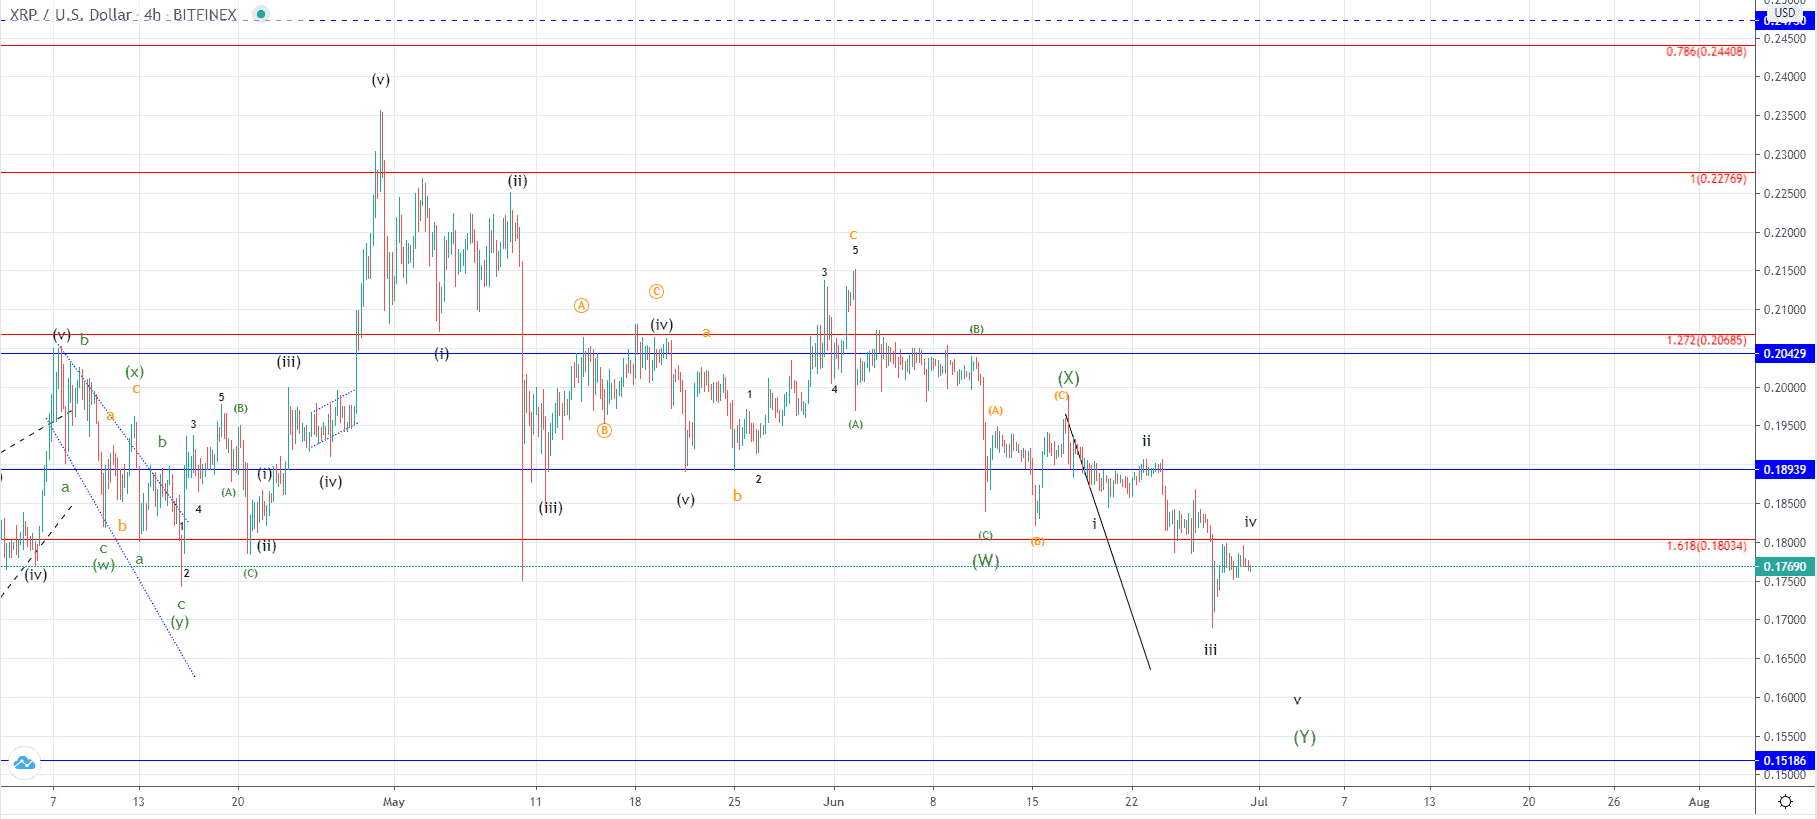
From Saturday’s low at $0.169 the price of Ripple has recovered by 6.26% as it came up to $0.17958 at its highest point but is currently being traded slightly lower as it started finding resistance below the 1.618 Fibonacci level.
After the completion of this descending move, we could be seeing a recovery of the same degree but a more longer-term downtrend could also look likely if the corrective WXY count get’s prolonged by two more waves X and Z.