BTC and XRP - Downtrend likely to continue.
BTC/USD
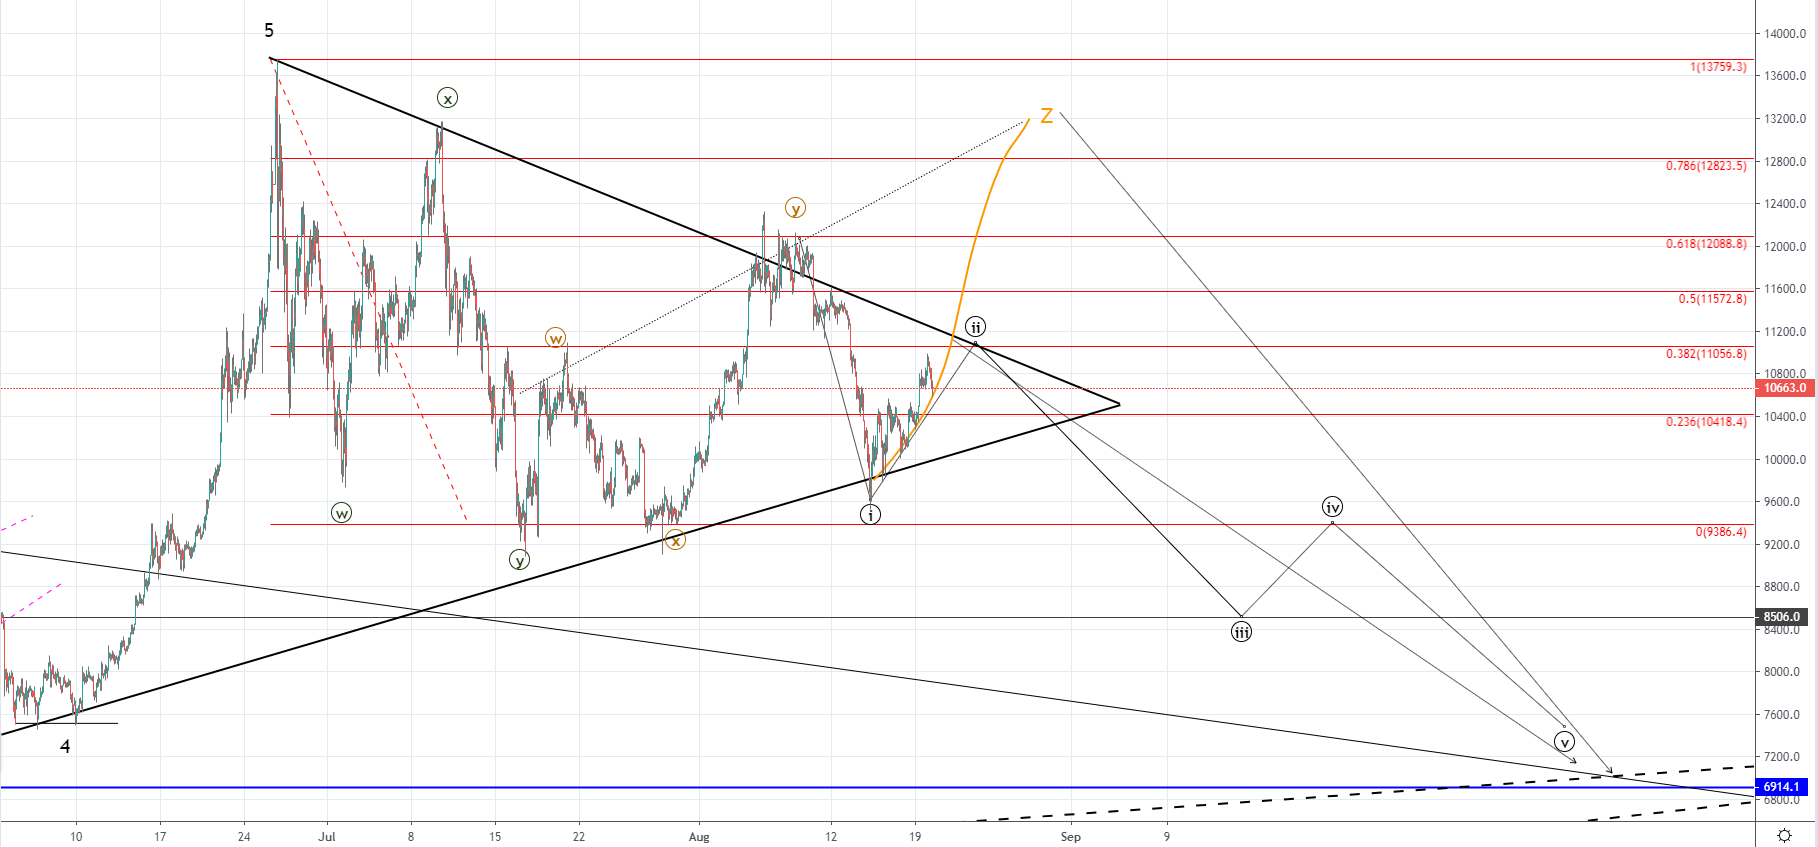
From last Thursday the price of Bitcoin has recovered by 13.41% as it came up from $9655 to $10950 at its highest point today. The price is currently being traded slightly lower as it reached close to its significant horizontal resistance level at around 0.382 Fib level which is why a minor retracement occurred.
As the downfall from the second upward WXY correction made a higher low we are still seeing the triangle pattern getting respected but the current recovery may also be corrective in nature which is why I would be anticipating a breakout to the downside in a five-wave manner. There is a possibility that we are to see a breakout to the upside from the symmetrical triangle in which case the WXY correction would get prolonged by two more waves and would mean that the previous downfall was the second X wave from the WXYXZ corrective count. But in either way I would be expecting the price of Bitcoin to be headed toward the $7000 area where multiple support points intersection is.
XRP/USD
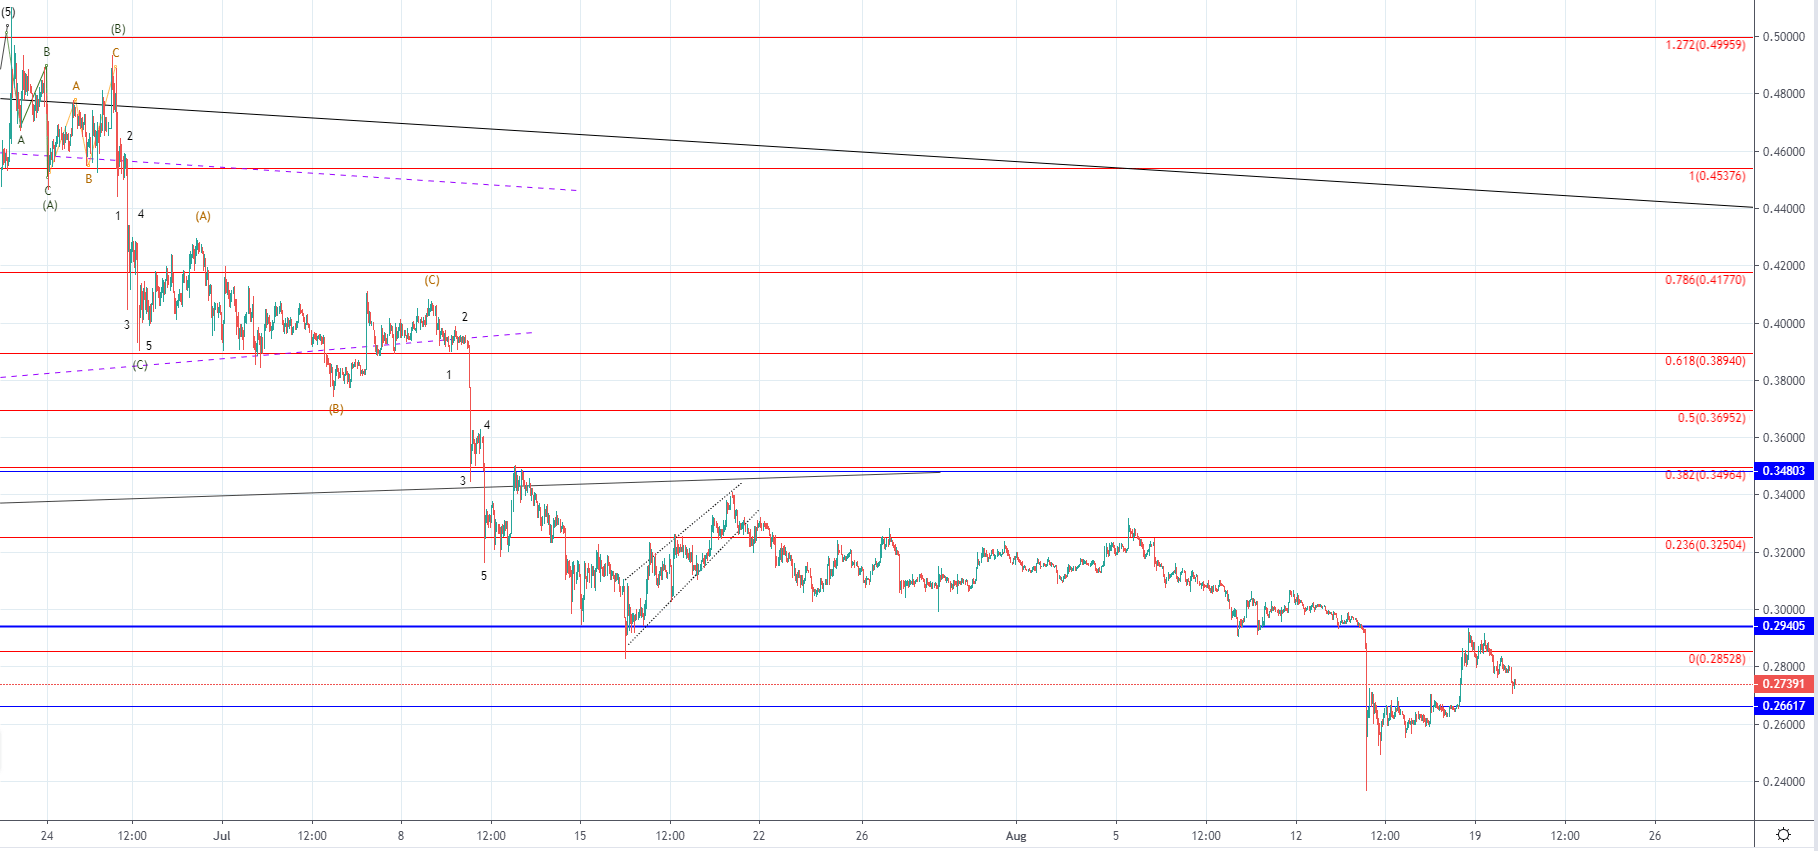
Last week on Wednesday the price of Ripple has broken its significant horizontal support level at $0.29405 and continued moving past the next one at $0.26617, reaching $0.25503 at its lowest on Thursday. From there we’ve seen a recovery of 15% until Sunday when a retest of the broken support level has been made, but as the interaction ended as a rejection another downturn occurred with the price currently trading at $0.27391.
There aren’t any clear signs of the bullish interest just yet with is why for now the downtrend continuation looks more likely but if this changes over the course of the next couple of days it could set the price of Ripple into a significant recovery potentially reaching the 0.618 Fib level again.