BTC and XRP - Further downside expected
BTC/USD
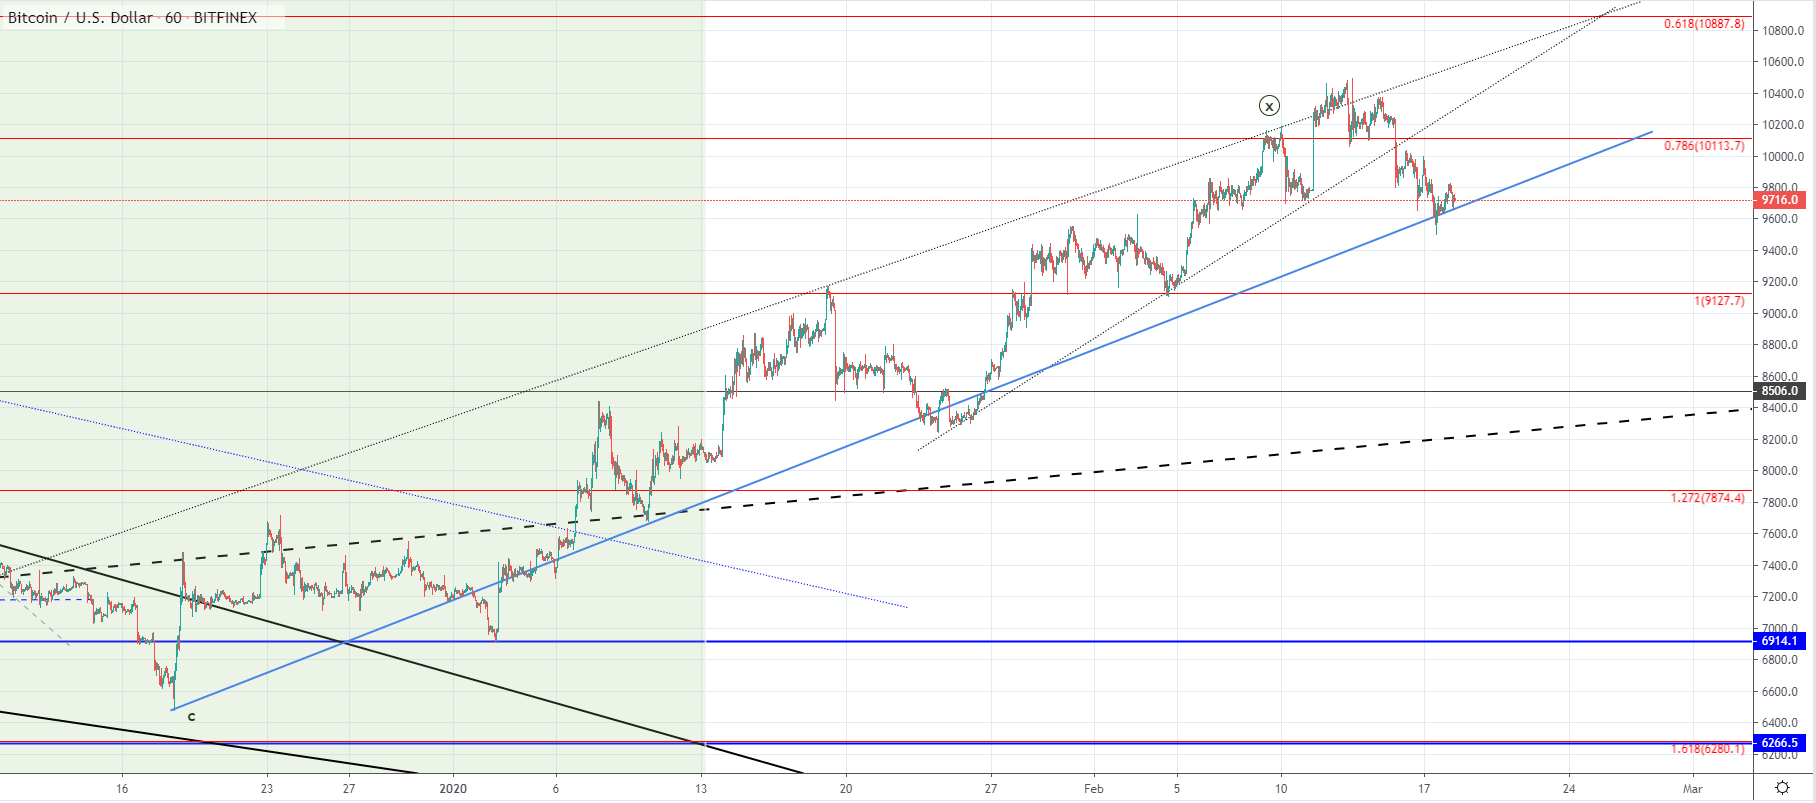
The price of Bitcoin has been in a decline since last Thursday when it came up to $10466 at it’s highest point. From there we have seen a decrease of 8.8% as it came down to $9546 at it’s lowest point yesterday. Currently, the price is being traded slightly higher than yesterday and is sitting at $9705.
The price broke the upper interrupted ascending trendline with strong bearish momentum which indicated the start of the correction of the same degree but it is still unclear whether or not the expected move to the downside has started. Until the price breaks the current level to the downside we can’t say for sure that the move to the downside has started although the previous breakout is providing an early indication.
The move to the downside which is expected to start would be the retracement to some of the significant support levels potentially at around $8500, especially if we are seeing the development of the next uptrend move. Another possibility would be that the increase seen from December last year is corrective in nature in which case they move to the downside would be the downtrend continuation move but for this, we are yet to receive confirmation.
XRP/USD
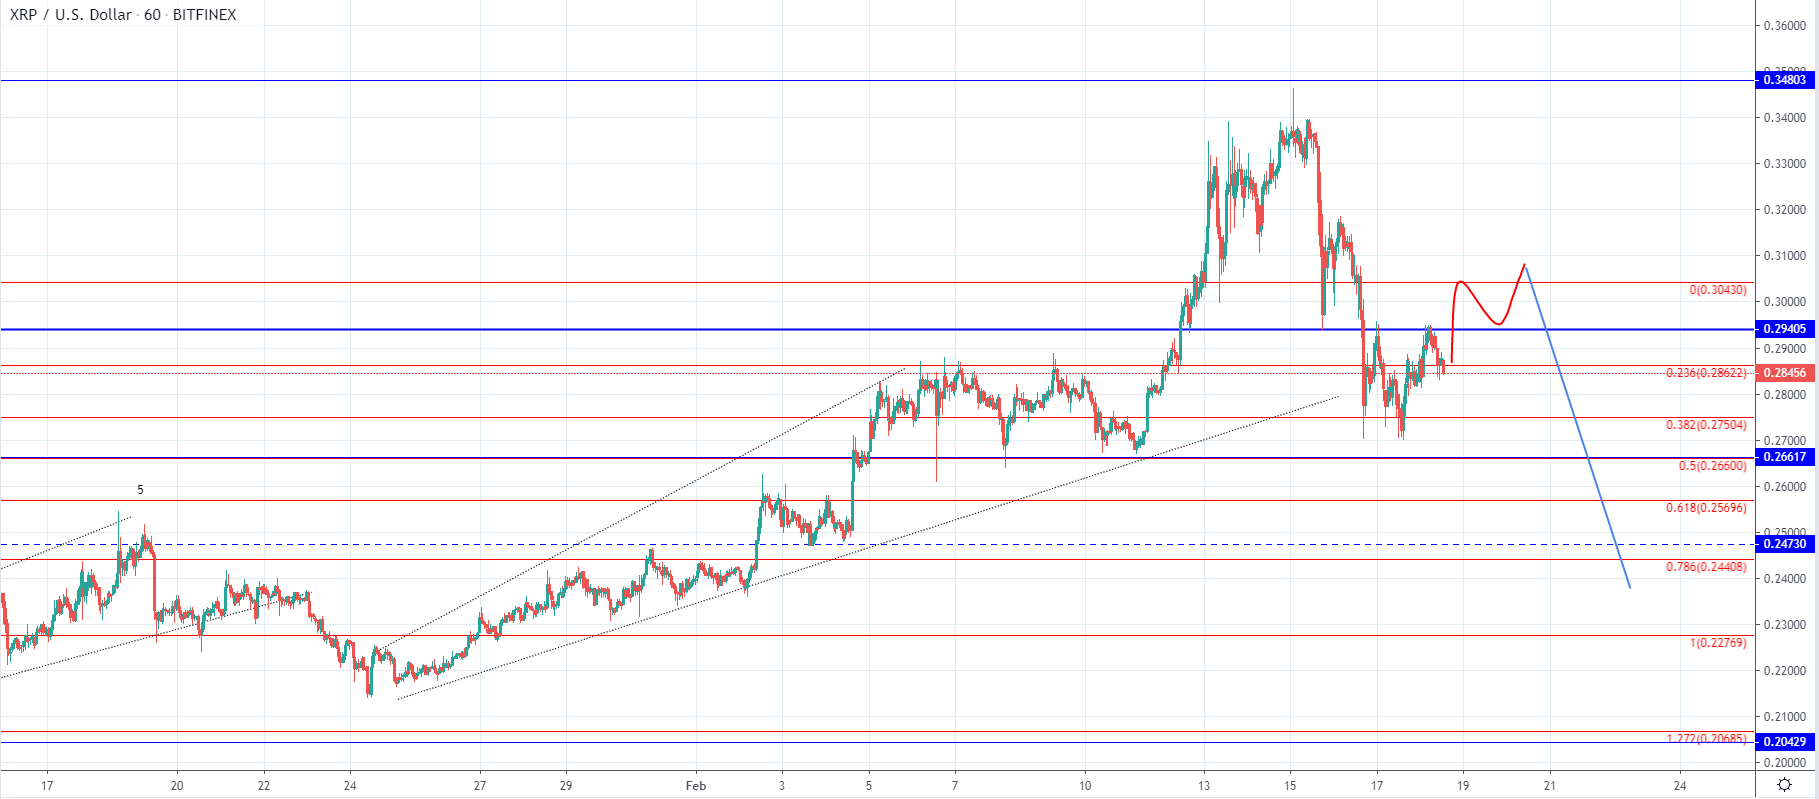
The price of Ripple has decreased more compared to the price of Bitcoin as it came down by 19.73% from Saturday’s high at $0.33982 until yesterday’s low at $0.27 but managed to recover by 8.51% since then and came up to $0.29338 at it’s highest point today. At the moment the price is being traded at $0.2844 and is struggling to stay above it’s significant horizontal support level.
As we have seen a sharp impulsive decline the current move is considered corrective in nature and is most likely the 2nd wave out of the ABC correction which started as the impulsive move to the upside ended. This is why I would be expecting further corrective increase potentially to the 0 Fib level after which a rejection that would occur is to push the price significantly lower as the C wave should develop.