BTC and XRP - Has the correction ended?
BTC/USD
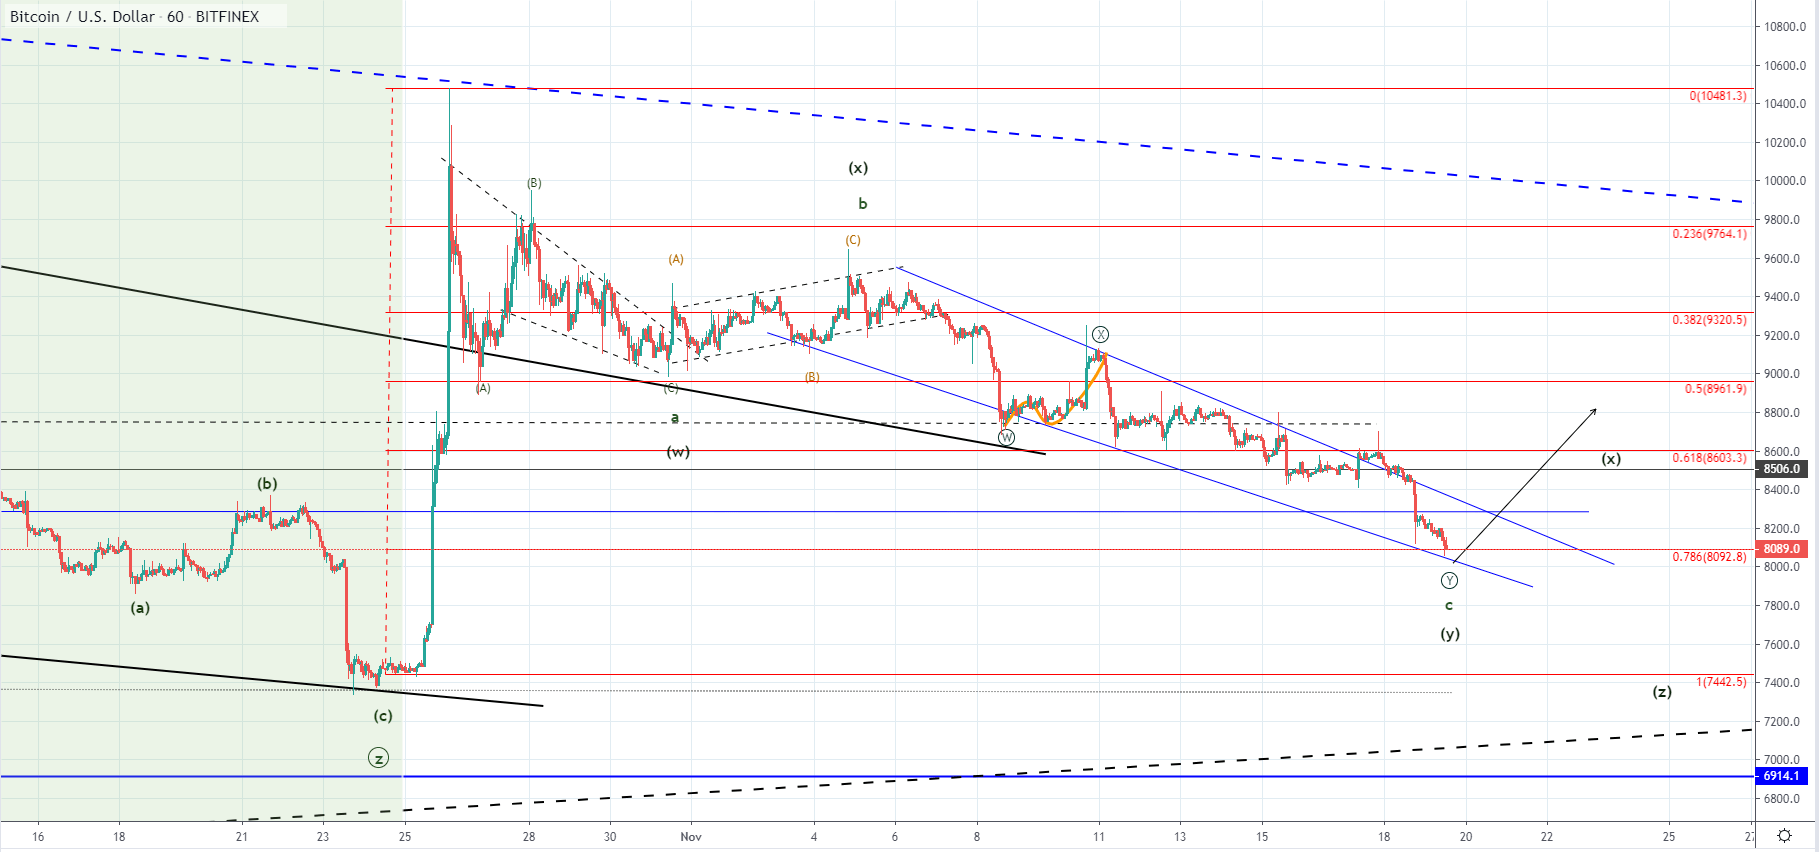
The price of Bitcoin has decreased by 5.64% from yesterday’s open at $8568 as it’s currently being traded at $8089. The price is still in a downward trajectory as the downtrend from the 4th of November hasn’t still developed fully.
Prior to the depreciation, we have seen a spike to the upside with strong momentum which indicated impulsiveness, so if we are seeing the start of an impulse wave to the upside with the current depreciation being its 2nd wave these levels are its perfect ending point. In theory, the price can fall back to the starting point of the starting impulse on the 2nd wave but considering the power behind the presumed 1st wave this shouldn’t happen.
However, the price fell below the light blue horizontal level which was the resistance point of the previous range and was expected to provide more support then it did. As the price entered the lower horizontal range so it did in a descending one from which a breakout was made when the price spiked to the upside.
This means that we could be seeing another corrective move with the previous spike being the A wave and the current structure is its B wave. After the current decline ends, another five-wave move to the upside would be expected either as a C wave or the 3rd wave from the next impulse wave. So from its momentum and significant level interaction, we are going to evaluate the possibility.
XRP/USD
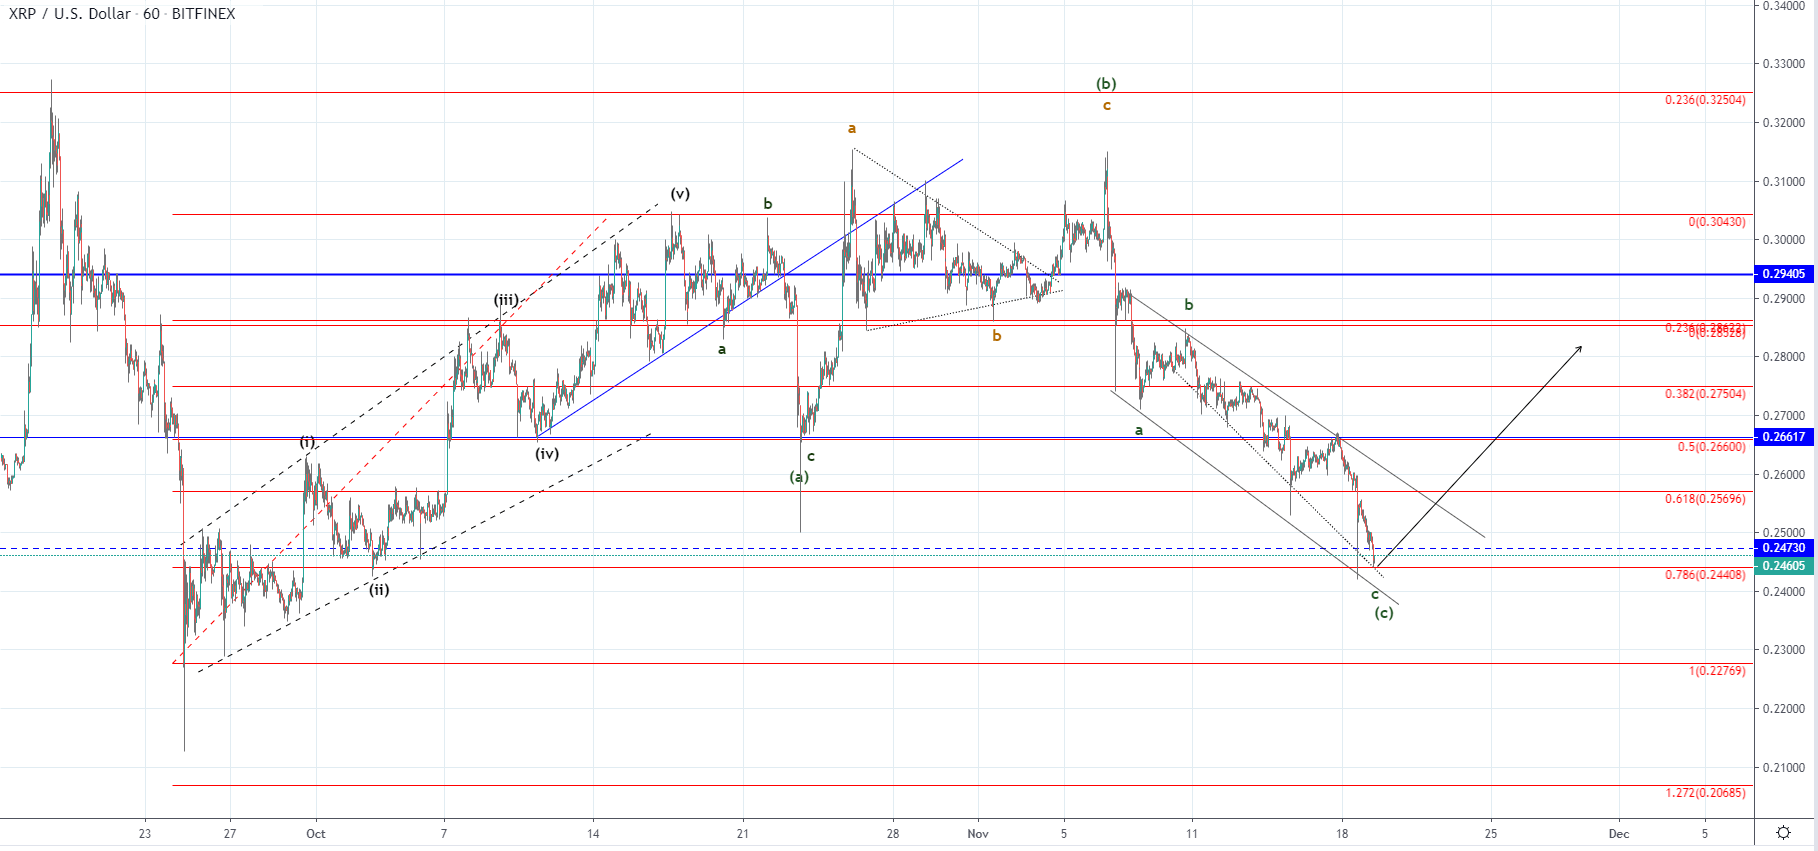
From yesterday’s high at $0.266 the price of Ripple decreased by 8.27% as it fell to $0.24407 at its lowest point today around which it is currently being traded. The price fell sharply to the 0.786 Fibonacci level and found support above the ending point of the previous 2nd wave.
Although this will be evaluated from the momentum behind the increase we could see the price going above the previous high. In that case, the expected move would be the 3rd of the higher degree count but like in the case of Bitcoin it also can be the C wave from yet another corrective structure.