BTC and XRP - Has the downturn started?
BTC/USD
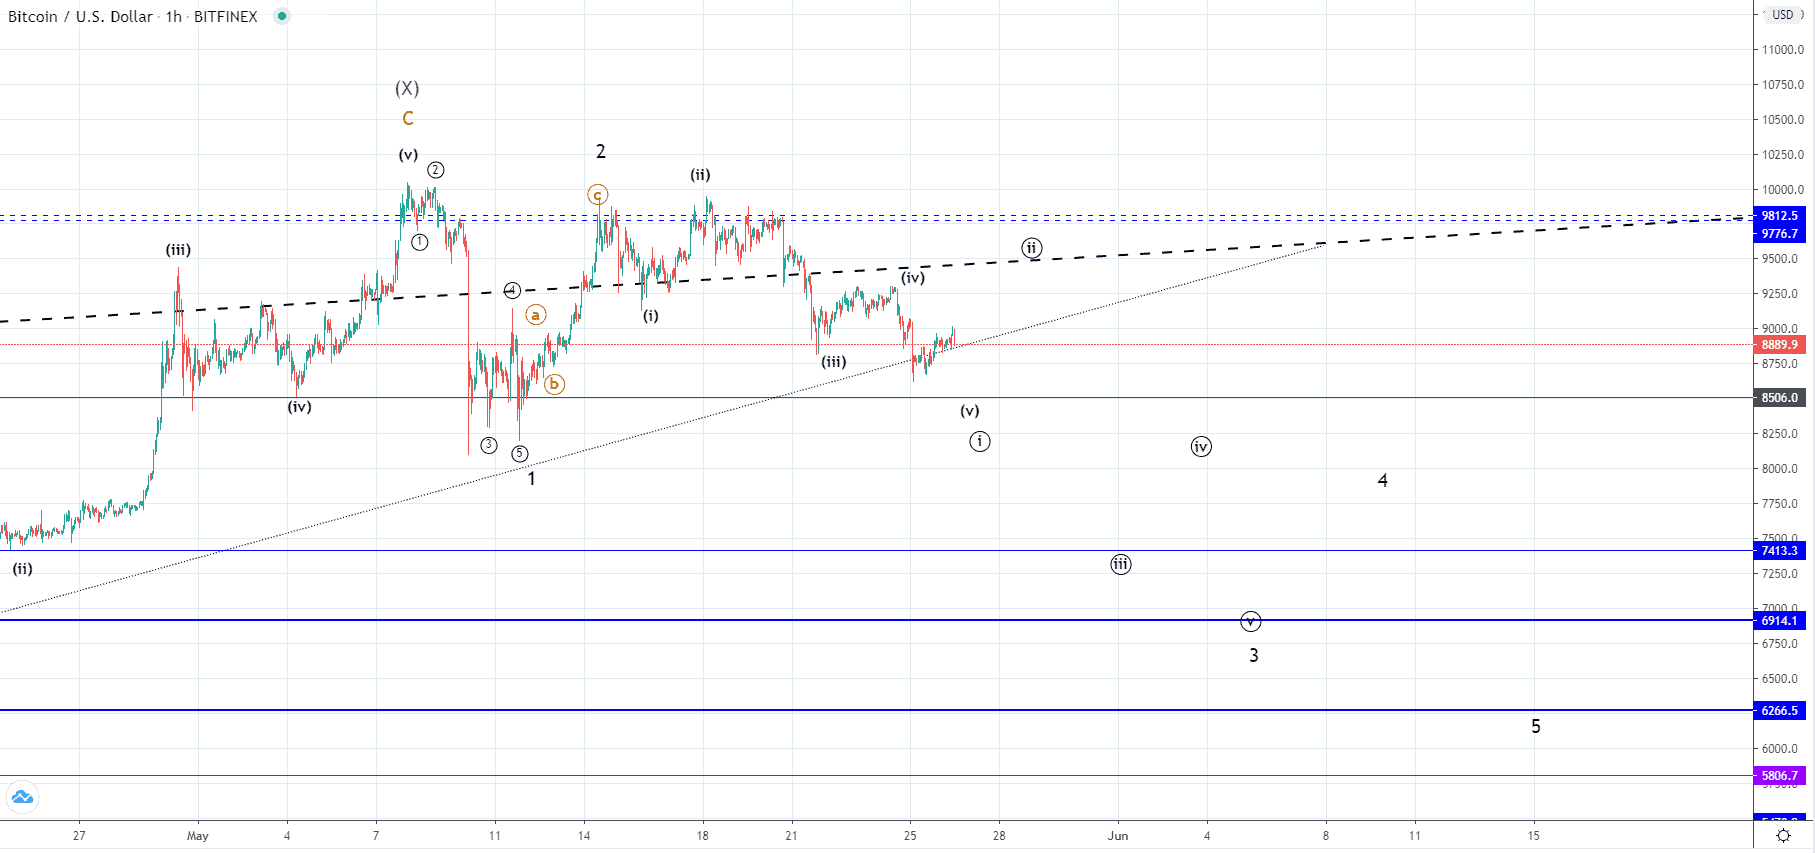
From last Monday when the price of Bitcoin was sitting at $9925 at its highest point we have seen a decrease of 12.61% measured to yesterday’s low which is the lowest point of the week so far and was at $8673. Since then we have seen a slight increase with the price currently being traded at $8897.
Looking at the hourly chart, we can see that last Monday’s high was an interaction with the horizontal resistance zone where the price got rejected a couple of times as it made an attempt to break out to the upside but the sellers’ pressure was too strong and repealed the price. The downward trajectory hasn’t still led the price below the prior low but this might change shortly as we have likely seen the completion of the corrective upward movement.
If this is true then the price is now likely to retest the $8500 area around the vicinity of the prior low which would be the first sub-wave of the 3rd impulse wave out of the starting downward impulse. As we are currently seeing a minor upward movement that is retesting the ascending trendline it’s continuation could be expected until the next upper ascending interrupted trendline which would be the 2nd sub-wave of the 3rd wave of the Minor count which is projected around $6914.
But if the price, however, manages to continue increasing beyond the significant horizontal resistance zone on this currently seen upward movement it would invalidate the count.
XRP/USD
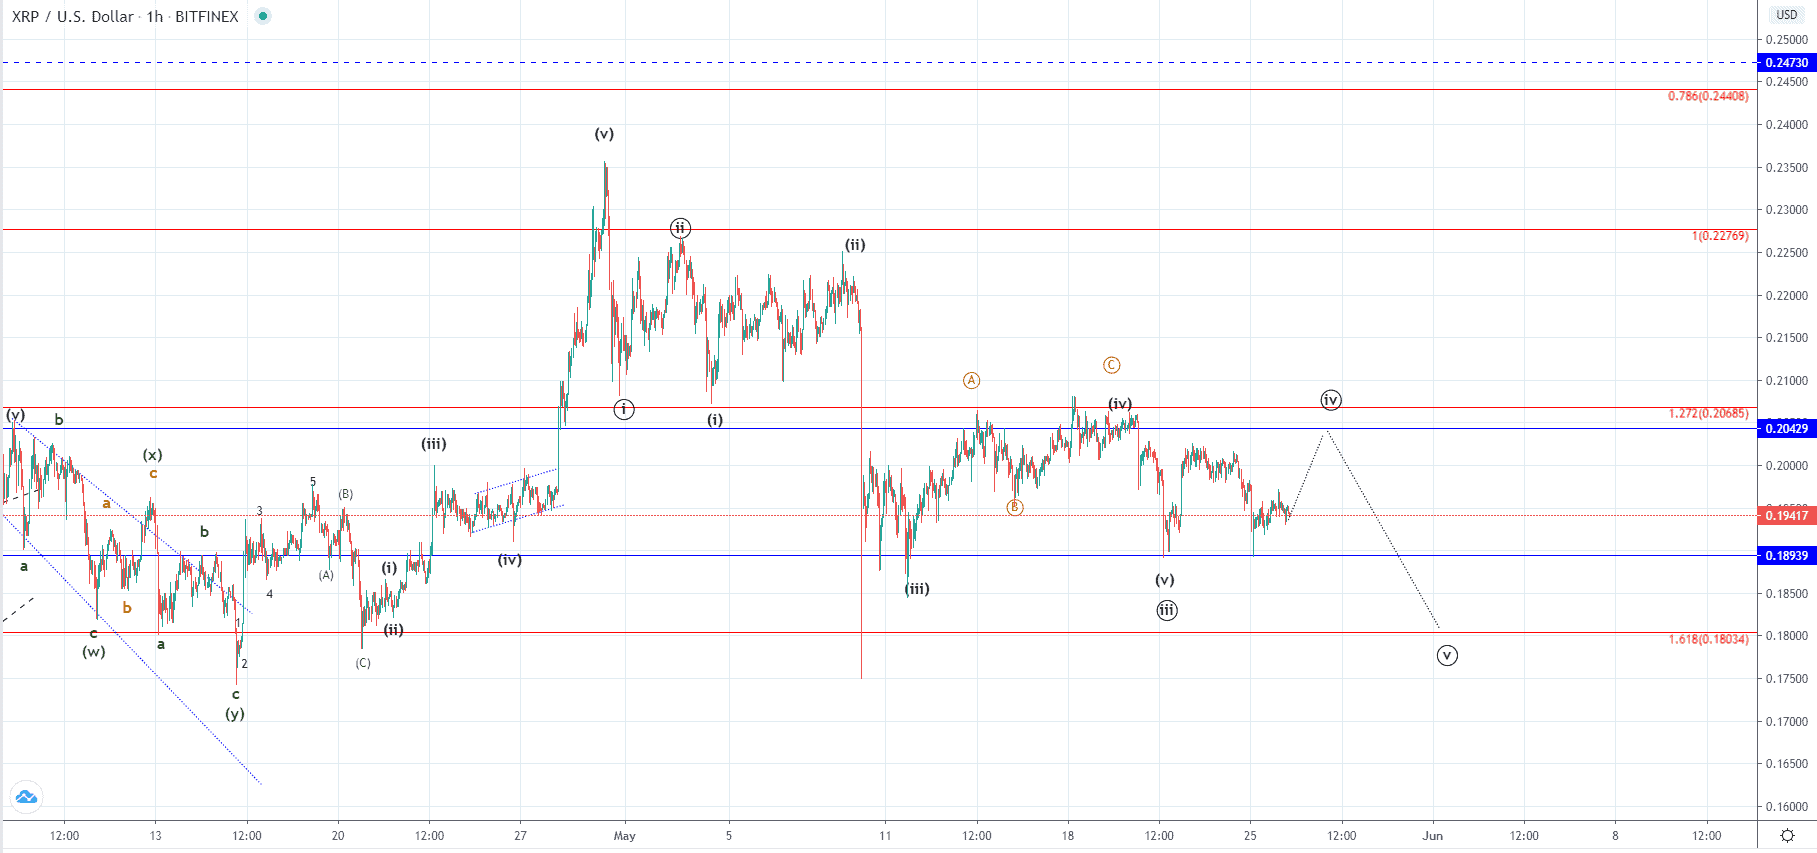
The price of Ripple has decreased by 8.92% from last Monday when it was sitting on $0.207 level measured to the at $0.189 level made on last Thursday but was retested again yesterday. At the moment the price is being traded at $0.19422 and is in an upward trajectory.
This movement is most likely the 4th wave out of the five-wave impulse to the downside with the currently seen upward one being a corrective sub-wave of the lower degree count. It could exceed the prior high by a little but it cannot go above the 1.272 Fibonacci level or it would invalidate the count. If this is true, then we are going to potentially see another retest of the Fib level’s resistance followed by another rejection which is set to lead the price of Ripple to the lower Fib level at around $0.18.