BTC and XRP: Has the expected downtrend started?
BTC/USD
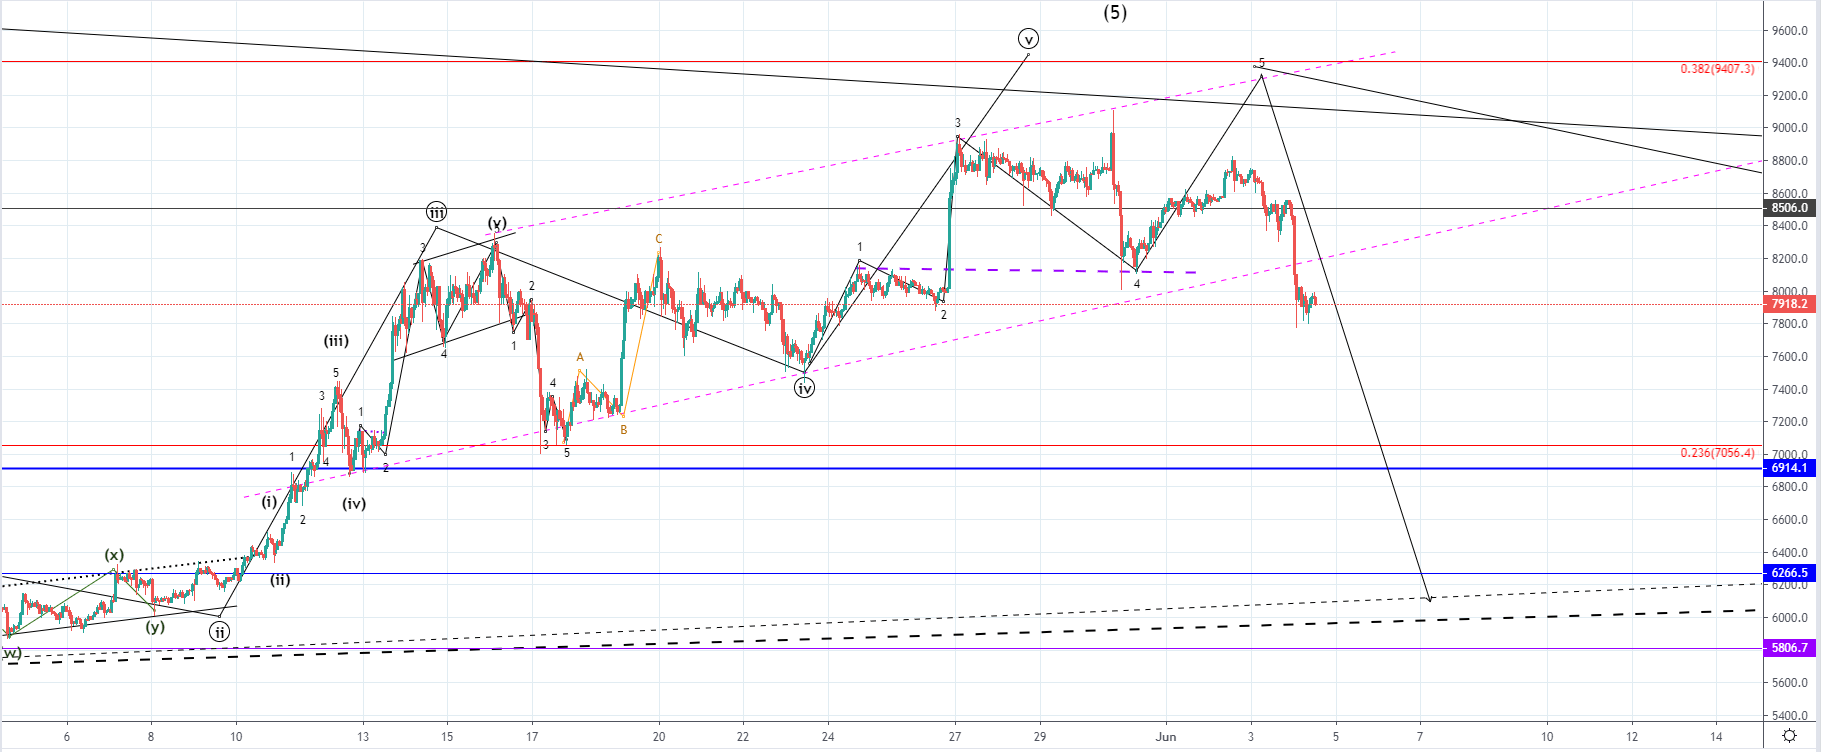
From yesterday’s high at $8742, the price of Bitcoin has decreased by around 10% today as it came down to $7856 at its lowest point. Over the weekend we have seen the price reaching $8970 and has expected to continue potentially increasing for another minor higher high and interact with the 0.382 Fibonacci level at around $9400 after the higher degree downturn starts.
If we have seen the completion of the five-wave impulse which is the sub-wave of the 5th wave from the Minor degree the decrease seen from last Thursday could be the starting downtrend with the first three-wave structure developing to the downside. As the price bearly made a higher high last Thursday coming up spiking it looked like another increase would occur. This could still happen if the ascending structure is still the 4th wave’s correctional movement developing but as the price fell to the 2nd wave’s ending point it will more likely not happen.
The price is now expected to go down to some of the broken resistance levels on the way up, out of which the first significant zone would be around $6250.
XRP/USD
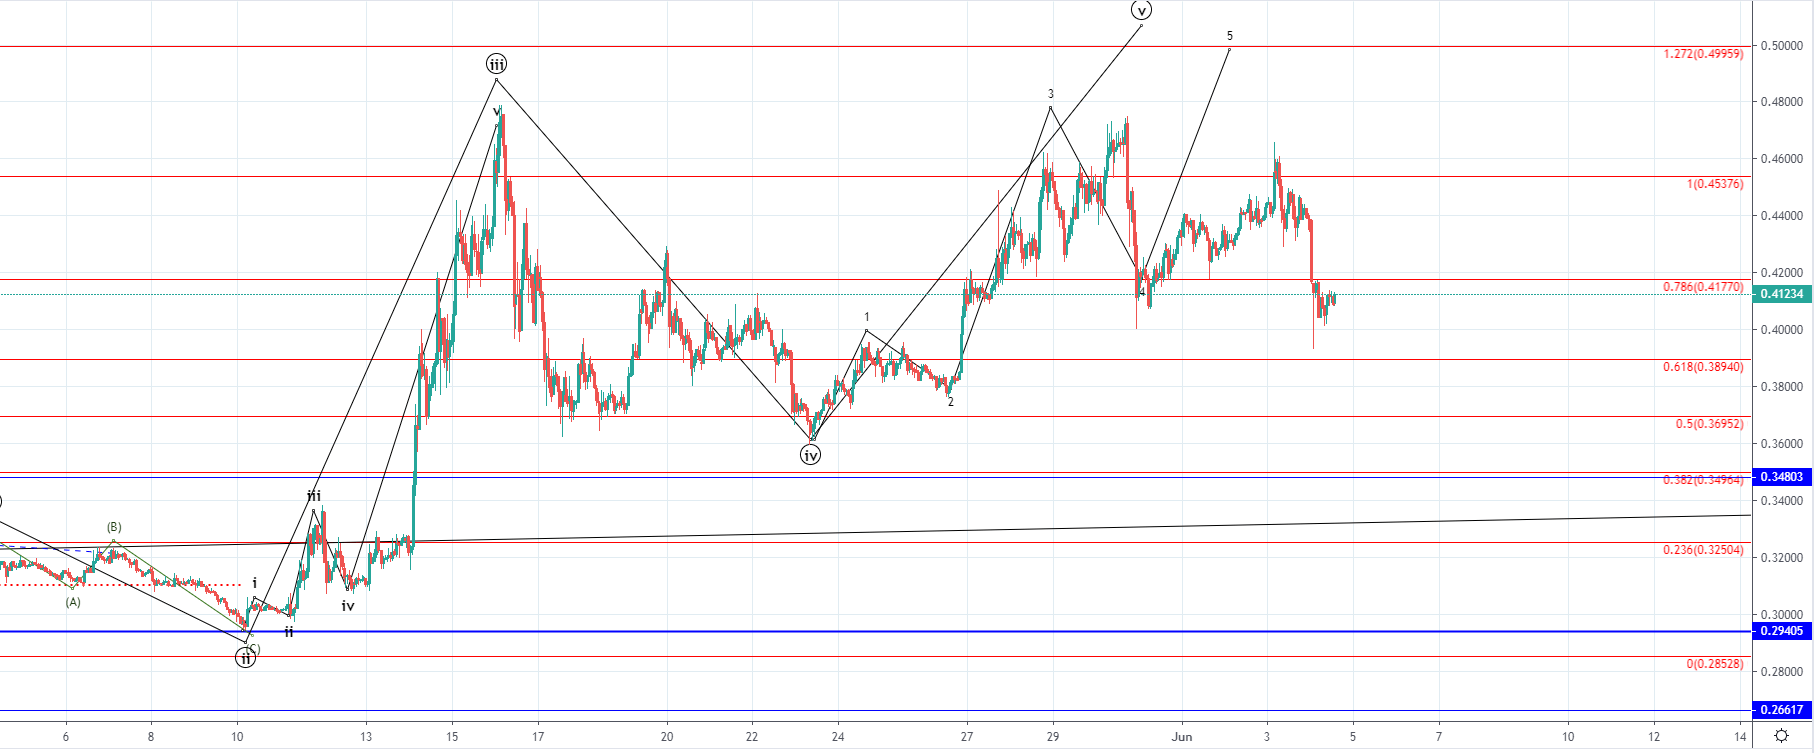
The price of Ripple has decreased by 12.36% from yesterday’s high at $0.46 as it came down to $0.4035 at its lowest point today. The price is currently being traded at around $0.412 slightly above today’s low. As the shart decrease has been made it could be an early indication of the starting downtrend which was expected but the price hasn’t exceeded the previous high last Thursday which makes this possibility still in play.
Looking at the hourly chart, we can see that the price of Ripple fell below 0.786 Fibonacci level which served as support but hasn’t come down to the 0.618 Fibonacci level. This means that unlike in the case of Bitcoin, the price of Ripple hasn’t entered the territory of the 2nd wave out of the last impulse to the upside and we could potently see another increase from here if this movement is the 4th wave’s correctional structure.
Interaction with the 1.272 was expected before the starting downtrend and as the price hasn’t gone above the May 16th high it could still do so. The other possibility would be that the 5th wave ended as truncation with the last Thursday’s high being its end in which case the three-wave movement seen from there would be the first structure out of the starting downtrend. If this is true we are now likely to see a higher degree move to the downside to some of the significant support level.
The most significant support level would be around $0.348 at 0.382 Fibonacci level which served as significant resistance on the way up, so if the price is to pullback for an establishment of support interaction with the mentioned level would be awaited.