BTC and XRP - Have we seen the end of the increase?
BTC/USD
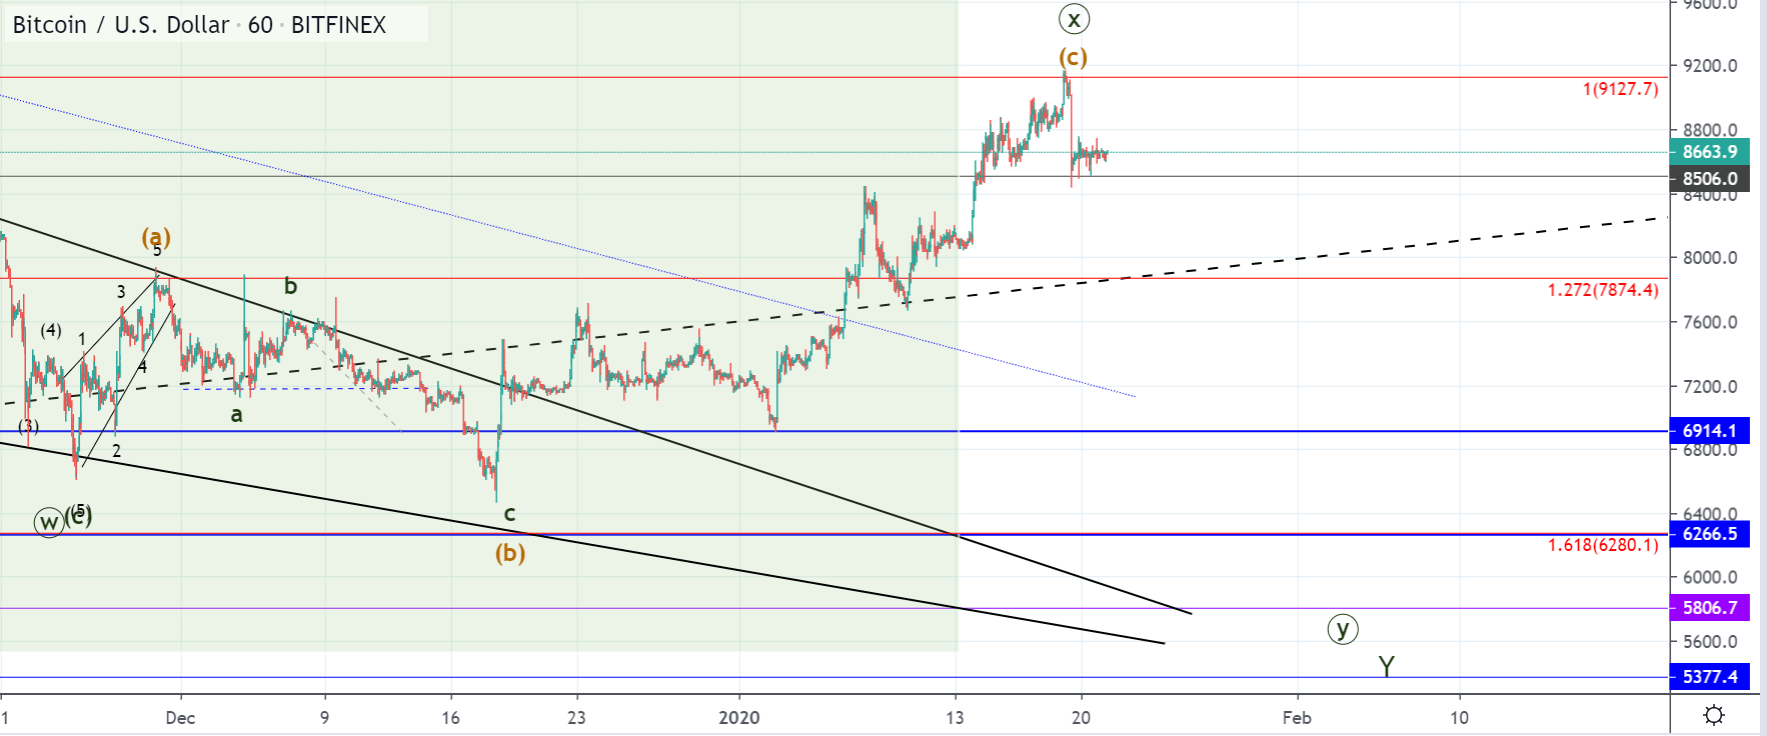
The price of Bitcoin came to $9127 at its highest point on Sunday making an interaction with the 1 Fibonacci level, but as the level served as resistance we have seen a rejection causing a decline of around 7.88% as it came to $8444 at it’s lowest. Currently, the price is being traded at $8663 and is above the significant horizontal level at $8506 which was retested for support.
The price of Bitcoin has been increasing since the interaction with the $6914 level which could have been the completion of the 2nd wave if we are seeing the development of a five-wave impulse. If this is true then the next retracement to $7702 at the interrupted ascending level could be its 4th wave which brings the interaction with the 1 Fib level as a potential ending point of the 5th wave.
In that case, the move to the downside could be of a higher degree and not just a minor retracement like the previous one. Another possibility would be that we are seeing another ABC to the upside developing in which case the C wave could go further to the upside before the downturn starts.
XRP/USD
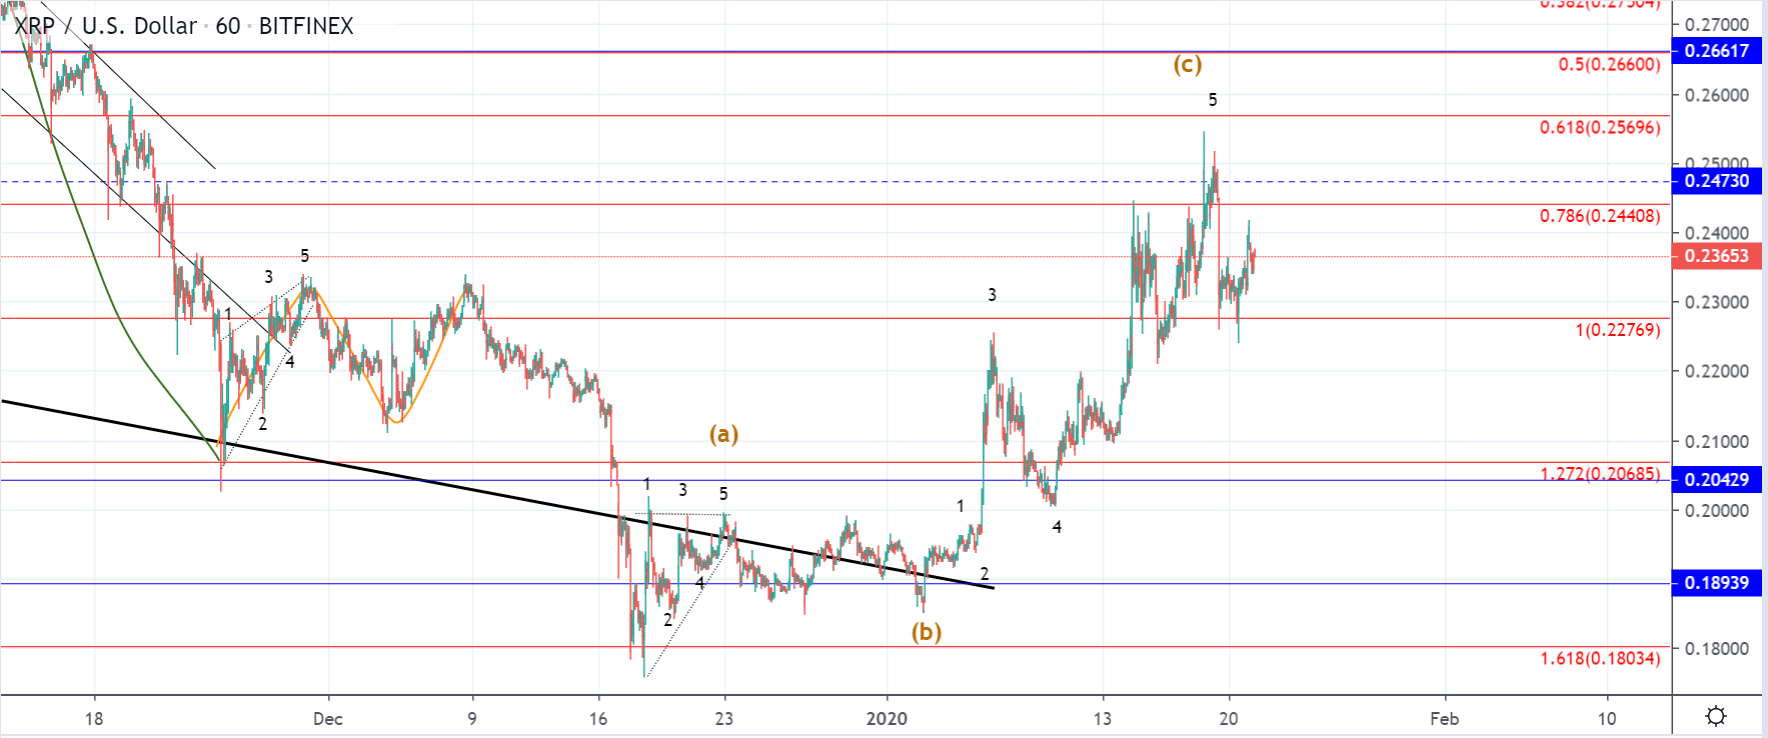
From Sundays high at $0.2514 the price of Ripple has depreciated by 10.67% measured to the lowest point the price has been so far which is at $0.2246. At the moment the price being traded slightly higher at around $0.2365 and is in an upward trajectory.
If we incorporate the previous move to the upside which was a minor ascending triangle we could be seeing the ABC to the upside which is corrective in nature. If this is true then the price is immediately heading for further lows and the ascending structure should be broken any time soon.
If however, the price hasn’t ended the development of its 5th wave the currently seen upside move should push the price to surpassing the previous high.