BTC and XRP - Increase could be corrective
BTC/USD
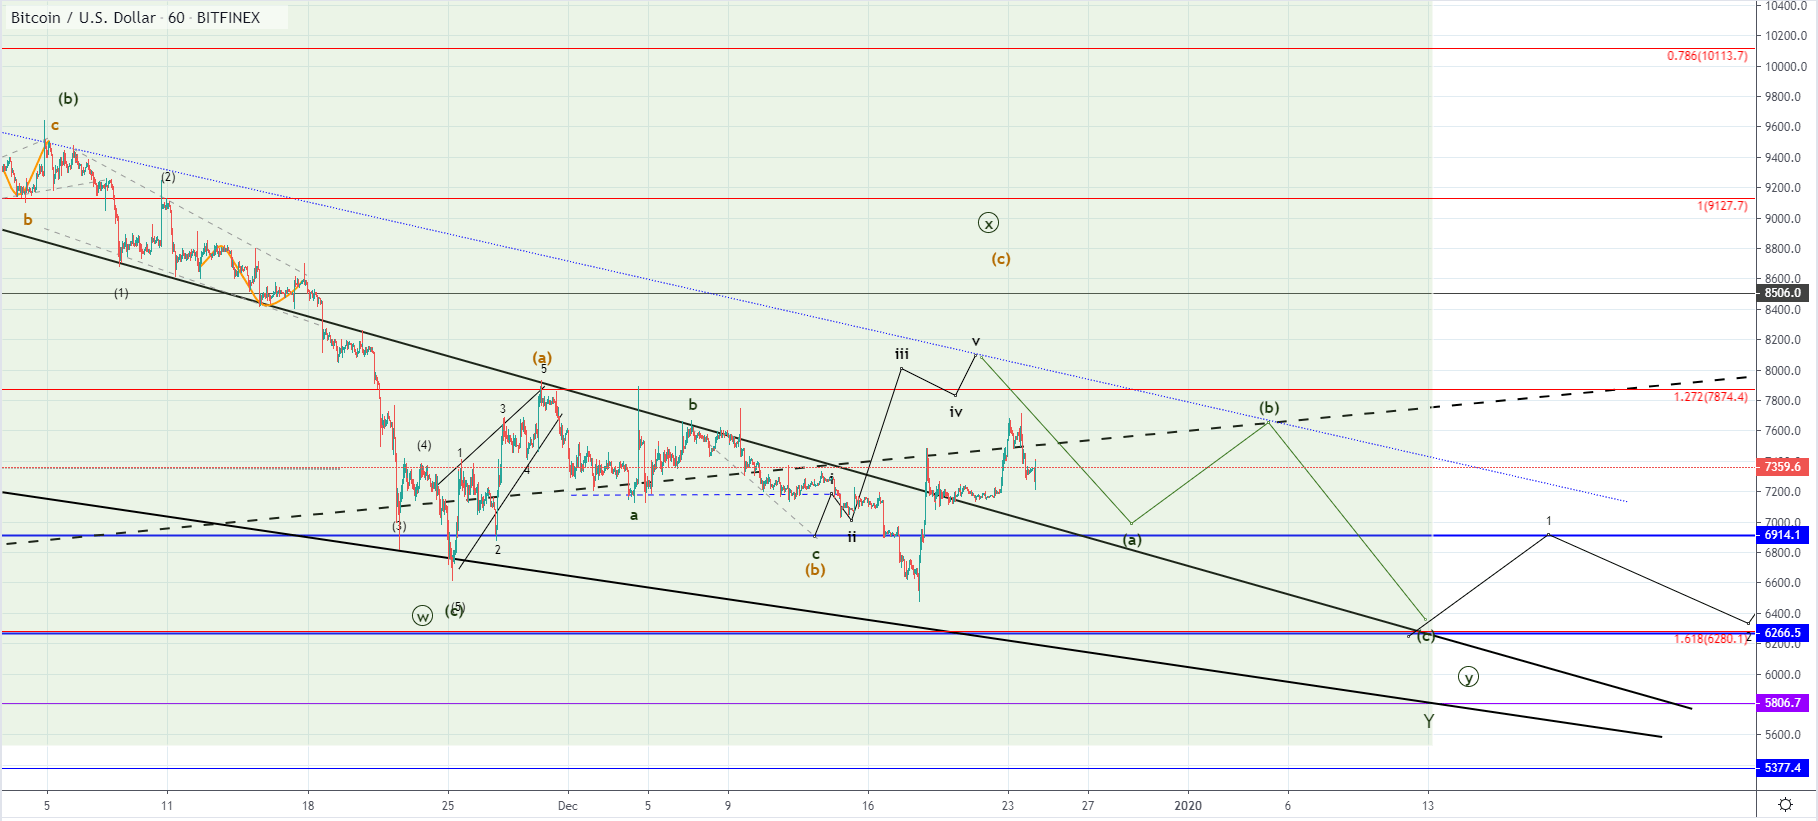
From last Wednesday when the price of Bitcoin was $6484 at its lowest point we have seen an increase of 18.67% as the price came up to $7694 at its highest point yesterday. Since yesterday’s high the price started pulling back and is currently sitting at around $7360 level.
This could have been the completion of the C wave the upside wave structure could be interpreted as a five-wave move, and especially considering that the B wave ended lower than expected so could have the C wave. As you can see the projection made has slightly higher targets with the C wave presumed to go above the ending point of the A wave. But as the B wave went below the starting point of the A wave this could have been the completion of the ABC to the upside.
We could see potentially another push to the upside but not far further as there are numerous resitance points above the current price levels. Some of them might get retested before another ABC to the upside starts but in either way, I would be expecting further sideways movement before another impulsive downfall from here.
XRP/USD
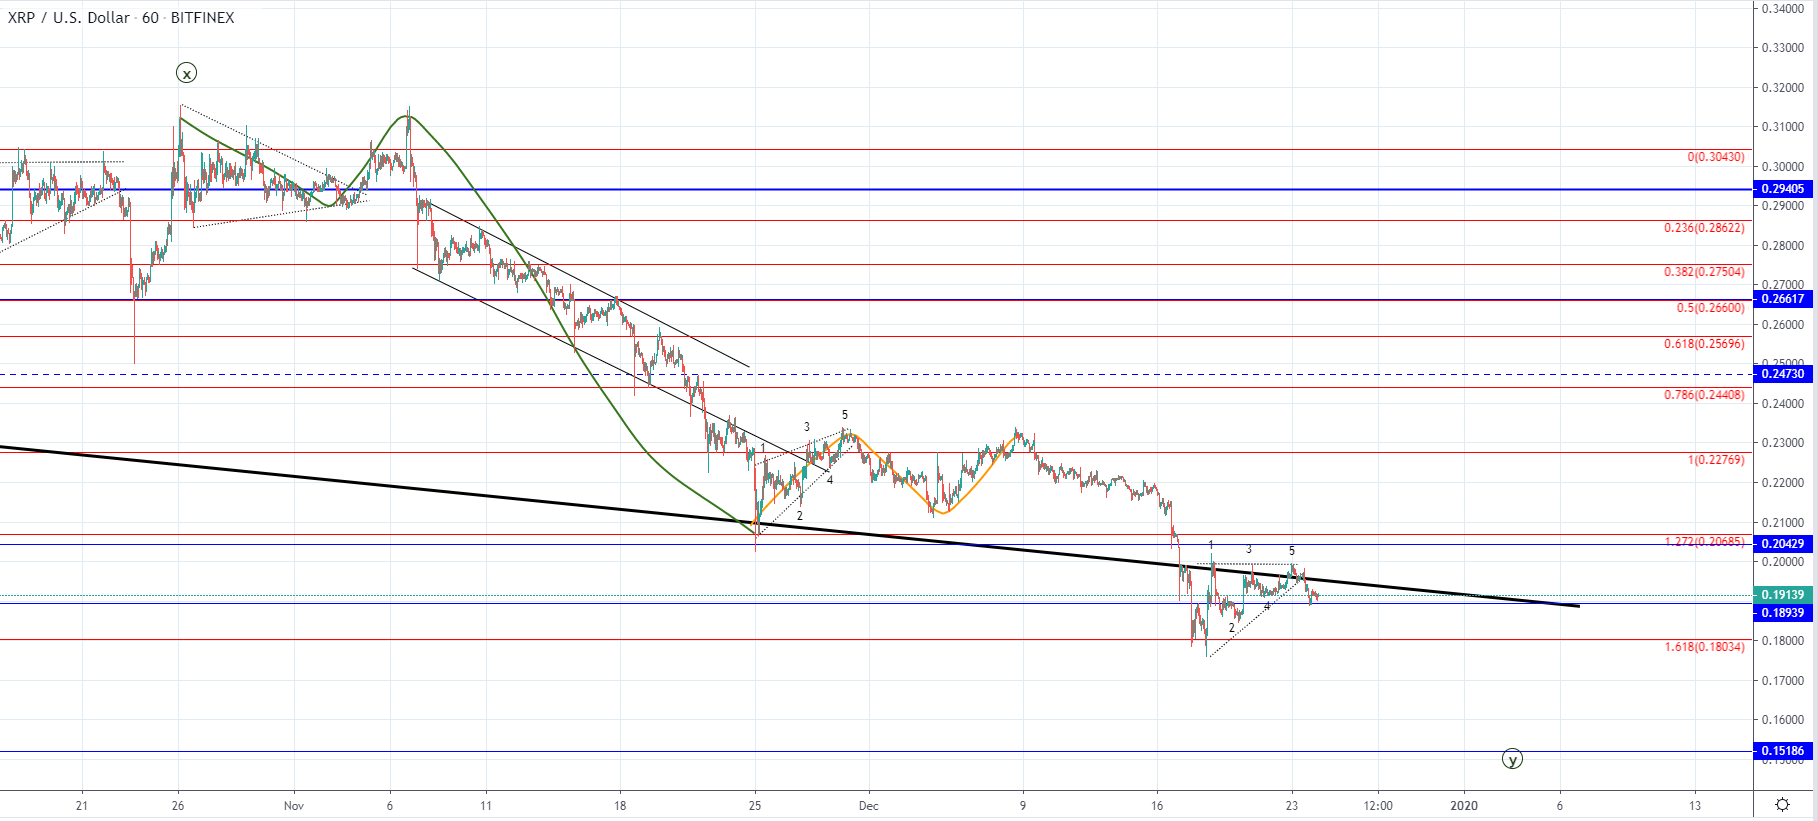
The price of Ripple has been struggling to get above the $0.2 mark ever since it fell below it last week. It is currently being traded at around $0.19130 and is in a downward trajectory.
But this could also be another corrective ABCDE before further depreciation for the price of Ripple. If the price stops decreasing above the 1.618 Fib level and starts moving to the upside above the descending trendline it could indicate the start of a recovery. But more likely we are going to see the price of Ripple going below 1.618 Fib level in which case further lows could be expected, potentially down to $0.15186 as its the next significant horizontal level in line.