BTC and XRP - Recovery continues but the prices are struggling to keep up the upward momentum
BTC/USD
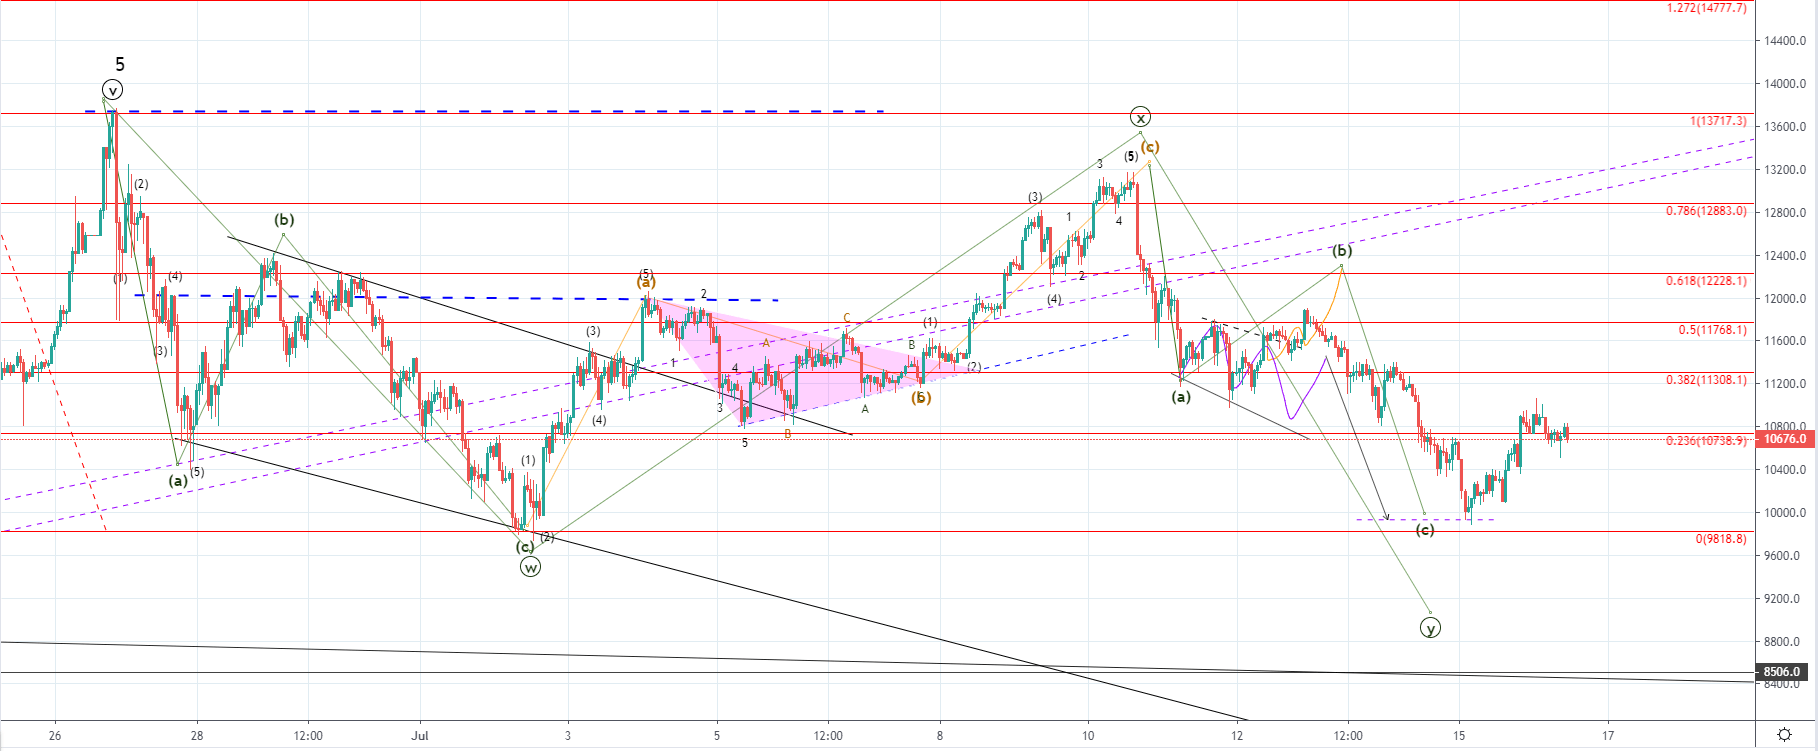
From yesterday’s low at $9931 the price of Bitcoin increased by 10% as it came up to $10932.2 at its highest point today. The price is currently being traded slightly lower at $10676 as a minor pullback occurred.
On the hourly chart, you can see that the price came above the 0.236 Fib level on today’s high and is currently retesting it for support on the retracement. The price is slightly below the Fib level but we can’t say that a breakout started as the price managed to stay around the level for eight hours. Today’s high was followed by wicks from the upper side which indicates that the price has entered the seller’s territory but we have seen a wick from the lower side on the hourly candle below the 0.236 Fib level which indicated buyers presence.
As the price is stuck in a consolidative range after an increase we could see a breakout from both sides. The price could find support here and continue moving to the upside for interaction with the next Fib level at $11308.1 or the seller’s pressure might be proven stronger in which case a drop below 0.236 level would occur.
We have seen the completion of the three-wave move to the downside yesterday which was most likely the third ABC correction out of the higher degree WXY. The recovery which followed could either be the start of the next impulse wave to the upside if the correction ended or could be the 4th corrective wave after another 5th one to the downside occurs in which case the downfall seen from the 10th of July when the price of Bitcoin was $13100 would be a five-wave move instead of the now labeled ABC.
If the price doesn’t exceed the 0.382 Fibonacci level on the current rise and rejection there causes a downfall below the 0.236 Fibonacci level, a lower low and the 5th wave scenario would look likely. But if the price manages to increase to the 0.5 Fib level at $11768.1 the start of another upside move would look more likely.
XRP/USD
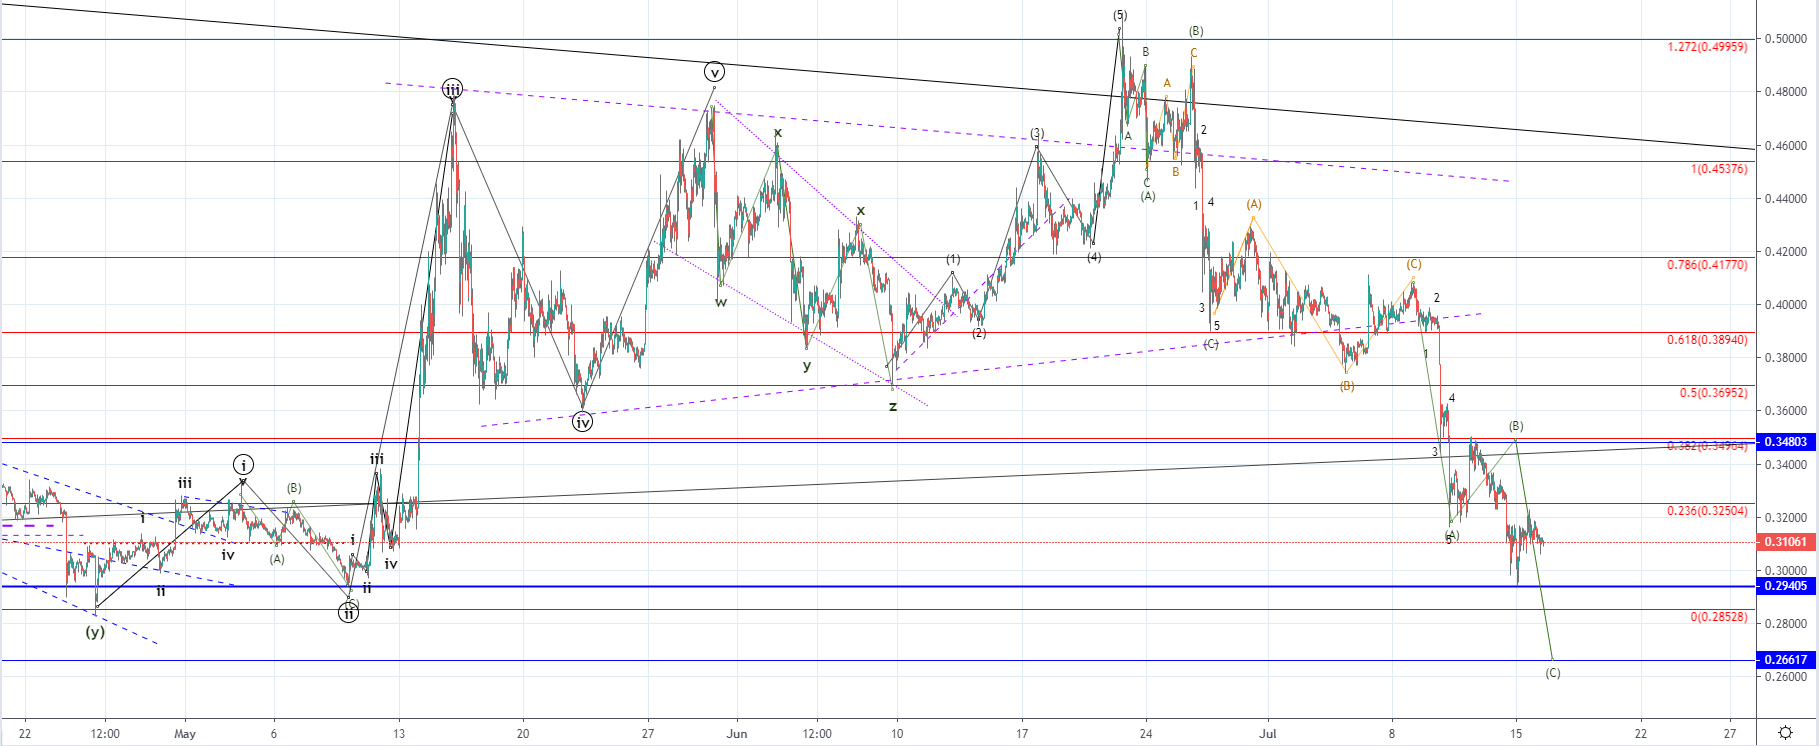
From yesterday’s low at $0.29979 the price of Ripple has increased by 6.63% today as it came up to $0.31996 at its highest point today. The price is currently being traded at around $0.31 as a minor retracement occurred.
The $0.29405 level is a highly significant support level but the price could retest the lower one at $0.26617 if we haven’t seen the completion of the third ABC to the downside. Prior to a breakout below the 0.236 Fib level, we have seen a five-wave impulse which is why the next move which was a retest of the 0.382 Fib level was considered as the B wave. But as the C wave is usually the equal or longer size than the A wave, further downside movement could be seen before its completion.