BTC and XRP - Recovery seen but it could still be corrective
BTC/USD
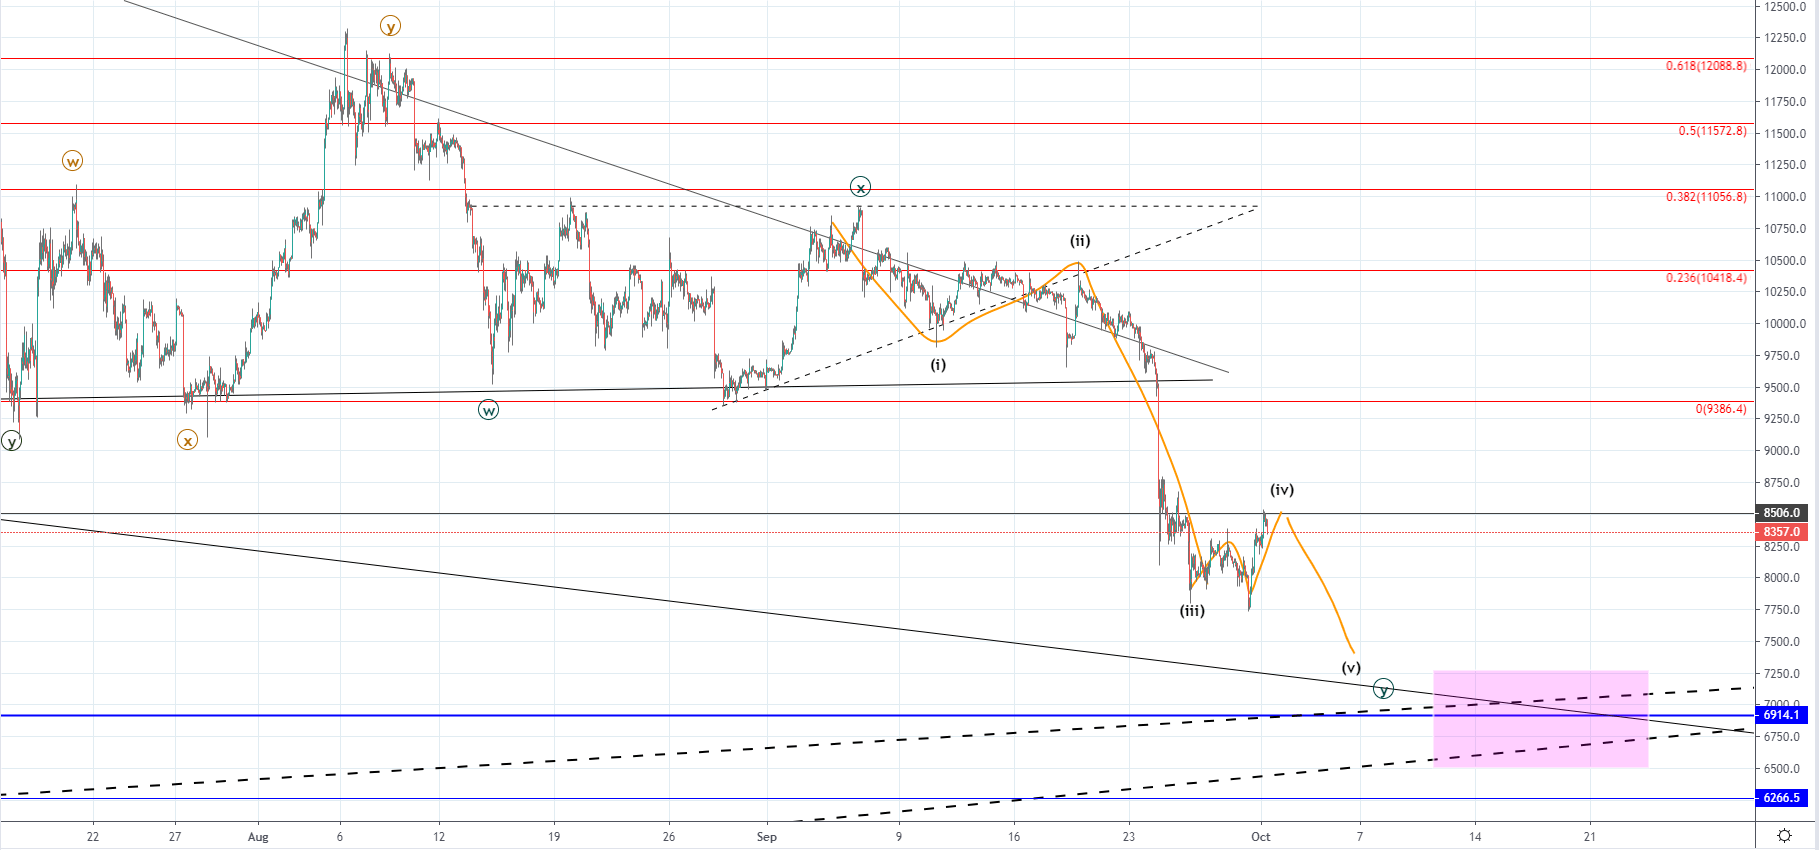
From yesterday’s low at $7775.2 the price of Bitcoin has increased to a significant horizontal level at $8500 today which is an increase of 9.38%. I was expecting that the level would serve as support on the way down, but the price continued moving below it which is why today we are seeing a retest of level for resistance. Currently, the price is being traded slightly lower at around $8357 as the price got rejected.
As the price has retested the level and is looking like it found resistance we could now see another drop starting which would be the 5th wave. If this is true then the price would soon start another move to the downside potentially ending at around $7389 but as it approaches the vicinity of the significant support intersection it might move a bit further to the downside to around $7000 as a retest of the support point.
Another possibility would be that the Y wave developed in which case yesterday’s low would be its lowest point and with the recovery seen being its first recovery wave. But as the momentum was strong on the way down I don’t believe that’s likey. This will be confirmed by the $8500 level as if the price continues moving above it, it could mean that the recovery started.
XRP/USD
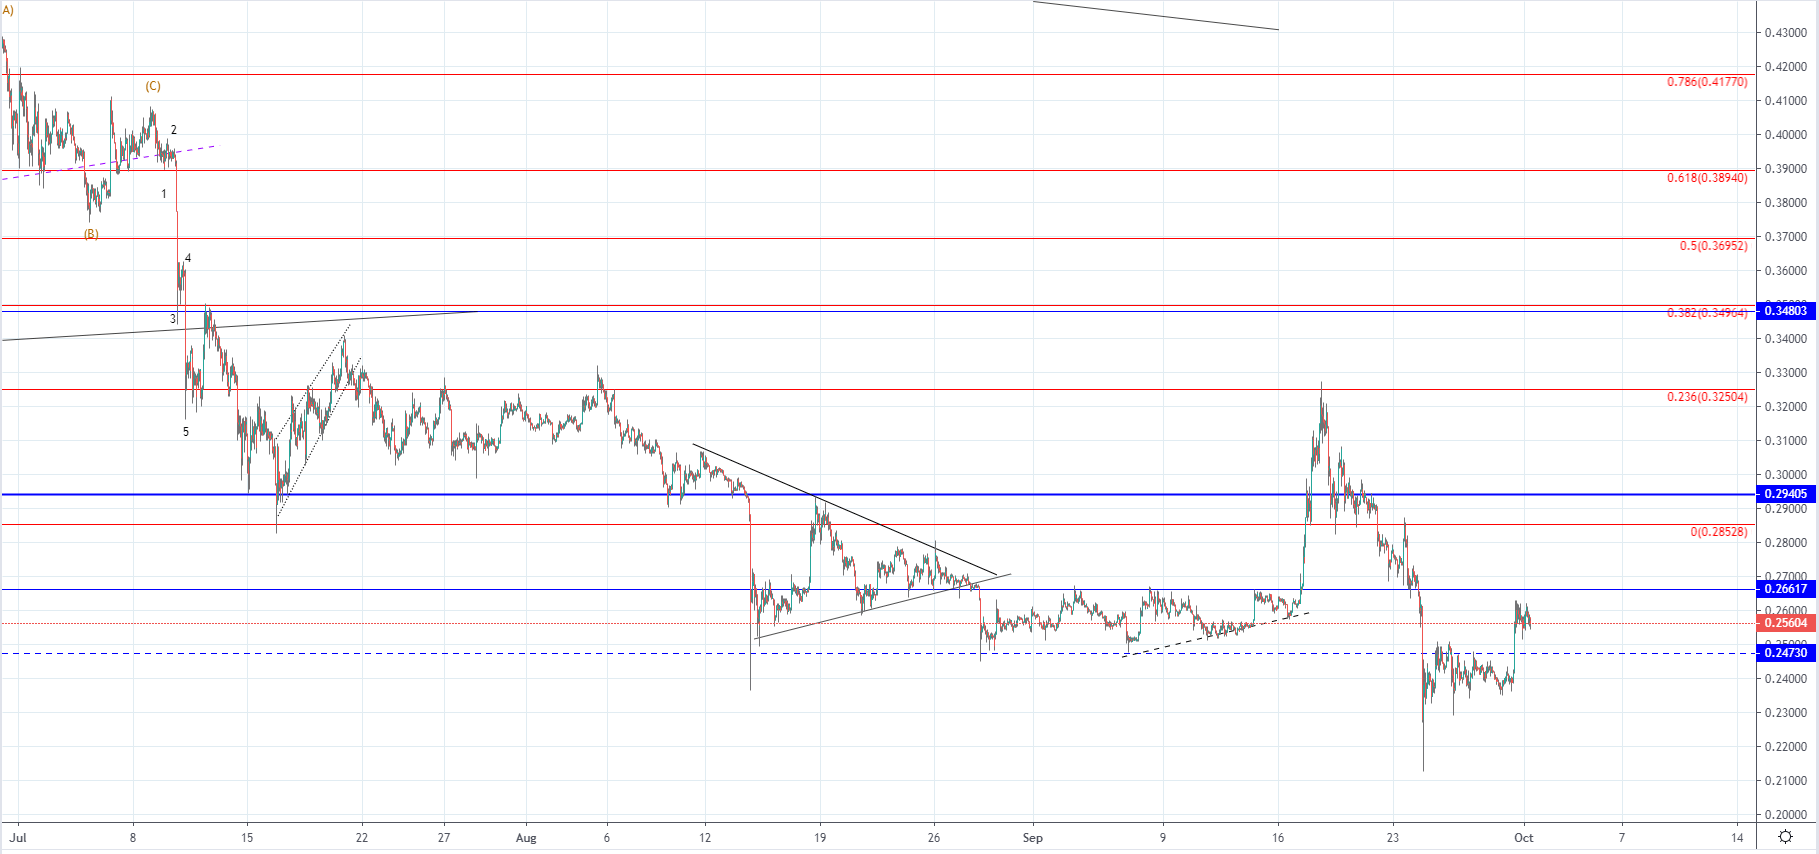
The price of Ripple has decreased by 30.19% from the 18th of September when it spiked to it’s highest at $0.32504 measured to the last Tuesday’s low at $0.22725. From there we’ve seen a recovery starting to develop with the price reaching around $0.26138 today which is a recovery of 14.72%.
If we see the price move above the $0.26617 level the increase will likely continue, but if the price interacts with the level and finds resistance there further depreciation could be expected.