BTC and XRP - Retracement seen but recovery is expected to continue
BTC/USD
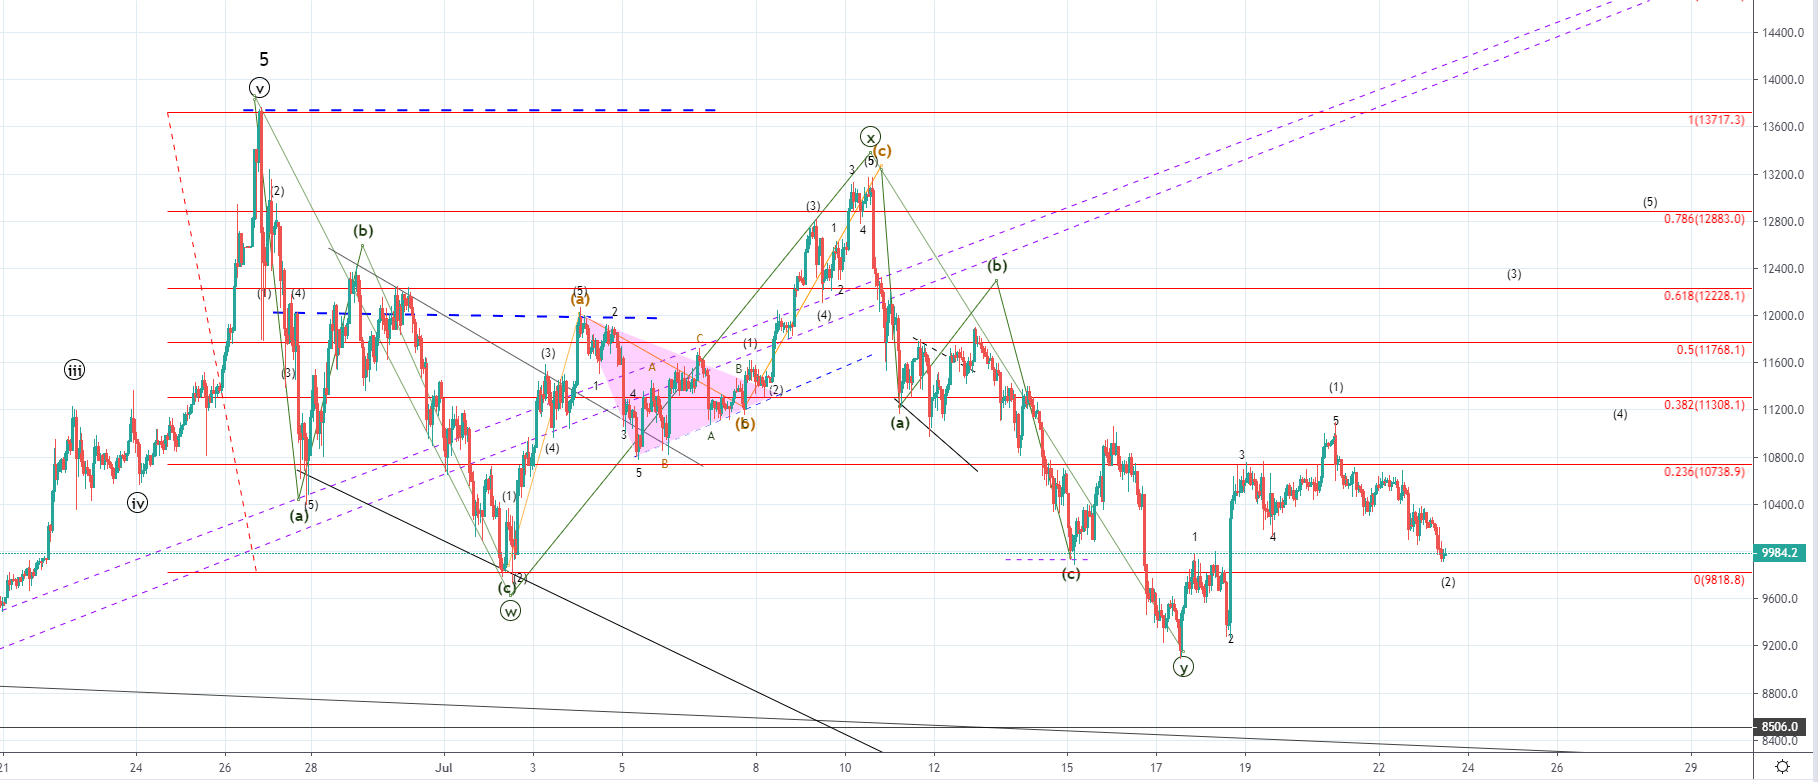
From yesterday’s high at $10976.7 the price of Bitcoin has decreased by 9.62% as it came down to $9920.6 at its lowest point today around which the price is currently being traded.
Looking at the hourly chart, you can see that the price came down to the 0 Fib level but there hasn’t been an interaction, as the price found support at the vicinity of the 1st wave’s ending point. As the WXY correction ended an upward five-wave move has been seen developing until yesterday’s high. There could still be a possibility that this wave hasn’t ended as we could be seeing the 4th wave developing.
Considering that the price fell impulsively and broke the significant ascending trendline I don’t believe that the 5h wave hasn’t ended. More likely we’ve seen the completion of the first wave with the downfall from yesterday being the start of the 2nd one.
If the five-wave increase seen from last Wednesday until Sunday’s open was the first sub-wave of the next starting impulse to the upside the downfall from yesterday’s high could continue to its starting point at $9168.3 before we see another upturn but considering the vicinity of the 0 Fib level I don’t believe that the 2nd wave would retrace that much.
This increase might end on the next upward wave as another three-wave corrective move which would mean that the WXY correction got prolonged by two more waves, but for now the projection is that a five-wave increase would occur, most likely above the 0.618 Fib level.
XRP/USD
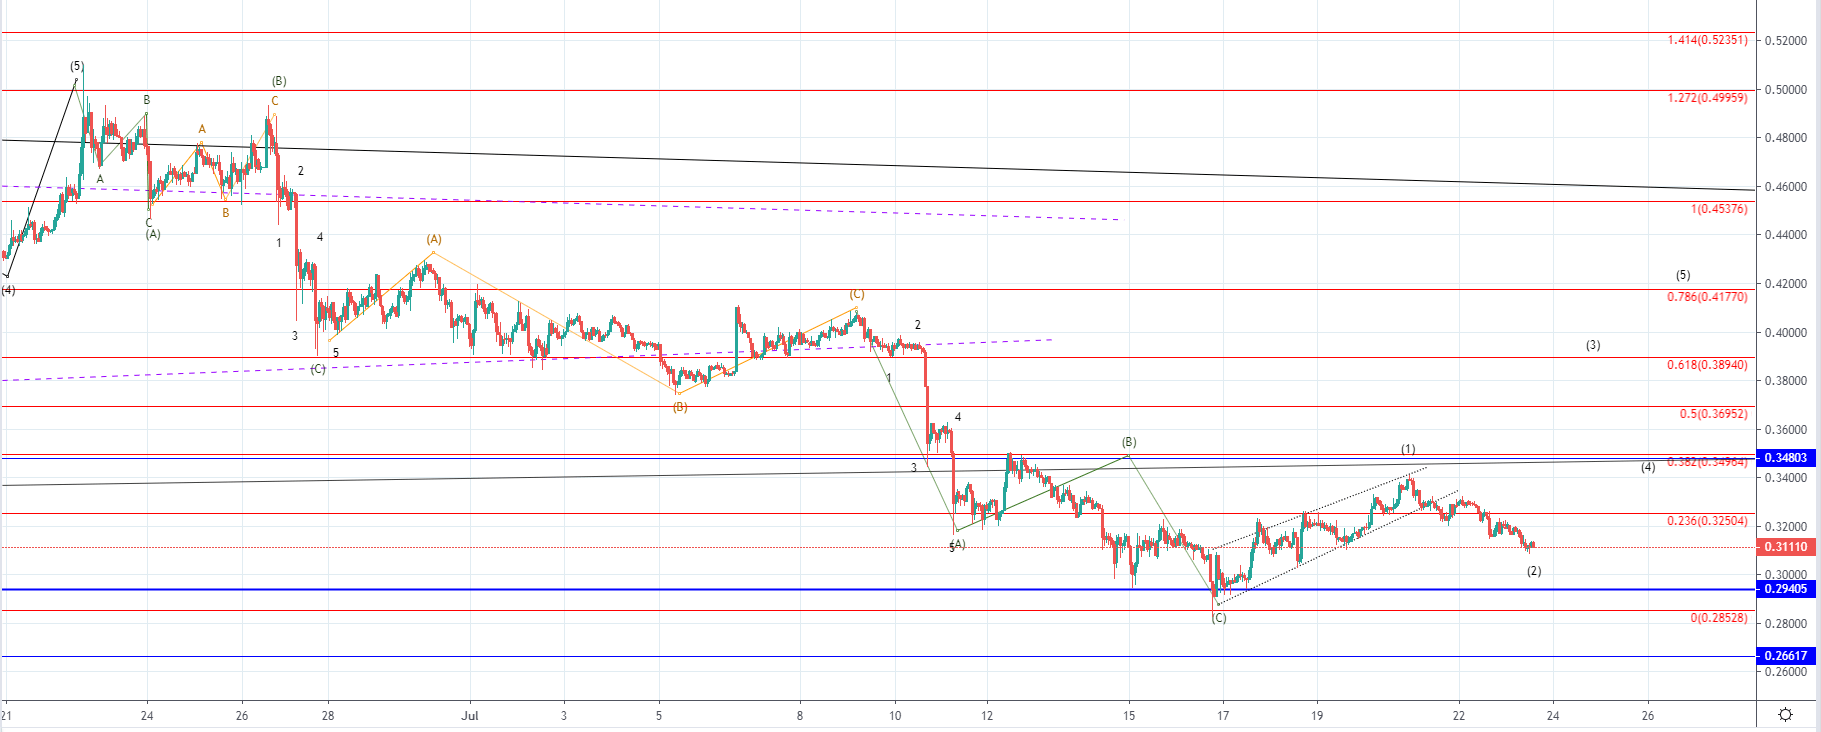
From yesterday’s high at $0.34129 the price of Ripple fell by 9.54% measured to its lowest point today at $0.30874 around which it is currently being traded.
This ascending triangle could have been the first wave out of the starting impulse wave to the upside as the corrective wave to the downside ended on the significant horizontal support level at $0.29405. If this is true then we are seeing the 2nd wave developing. The 2nd wave looks near completion but further decrease could be seen before its completion as another retest of the significant horizontal level might occur.
In either way, after this retracement, I would be expecting another increase above the significant resistance point and potentially all the way to the 0.786 Fibonacci level at $0.4177.