BTC and XRP - Sideways movement seen, but a breakout soon expected
BTC/USD
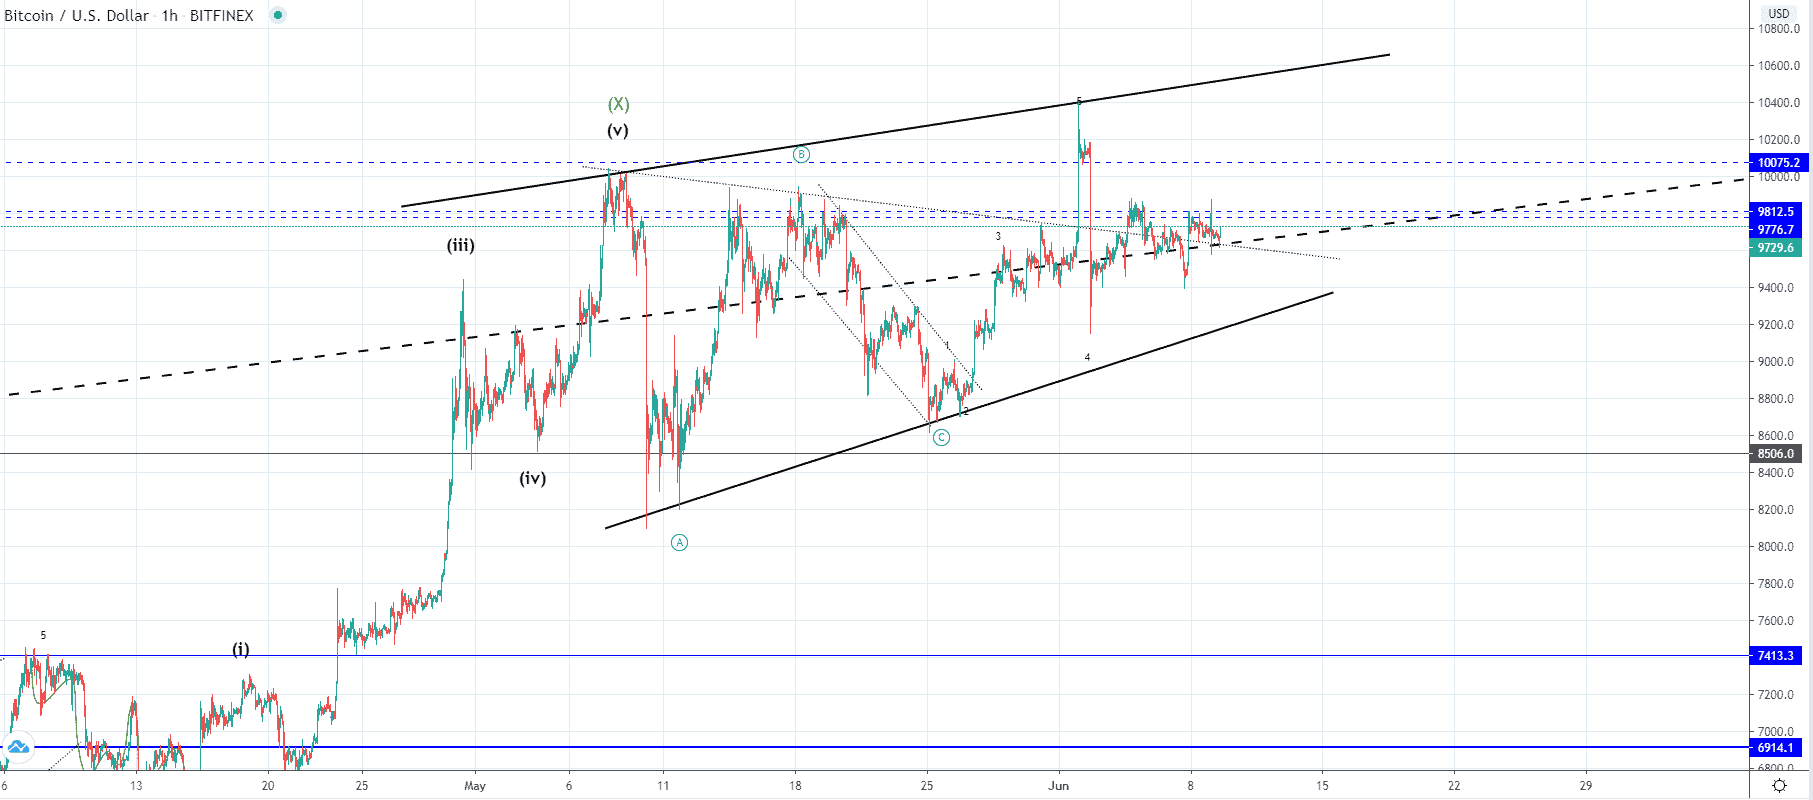
Last Tuesday the price of Bitcoin spiked to $10400 at it’s highest point from where a decrease of 11.6% has been made reaching $9143 at it’s lowest. The price fell sharply to the downside below the starting point of the prior increase after which we have seen a minor recovery to $9859 at its highest point. Since then the price has fell back to the interrupted ascending trendline and made another attempt to break above the significant horizontal resistance zone but the attempt failed for now and is still being traded in a tight range.
Now as it again found resistance at the significant horizontal area but fell to the minor descending trendline where it found the support we are most likely to see another impulsive move that is to lead the price into a breakout. It is still unclear which direction the breakout could occur especially as the price is in the mid-range of the ascending structure but another retest of it’s outlined levels could be expected.
XRP/USD
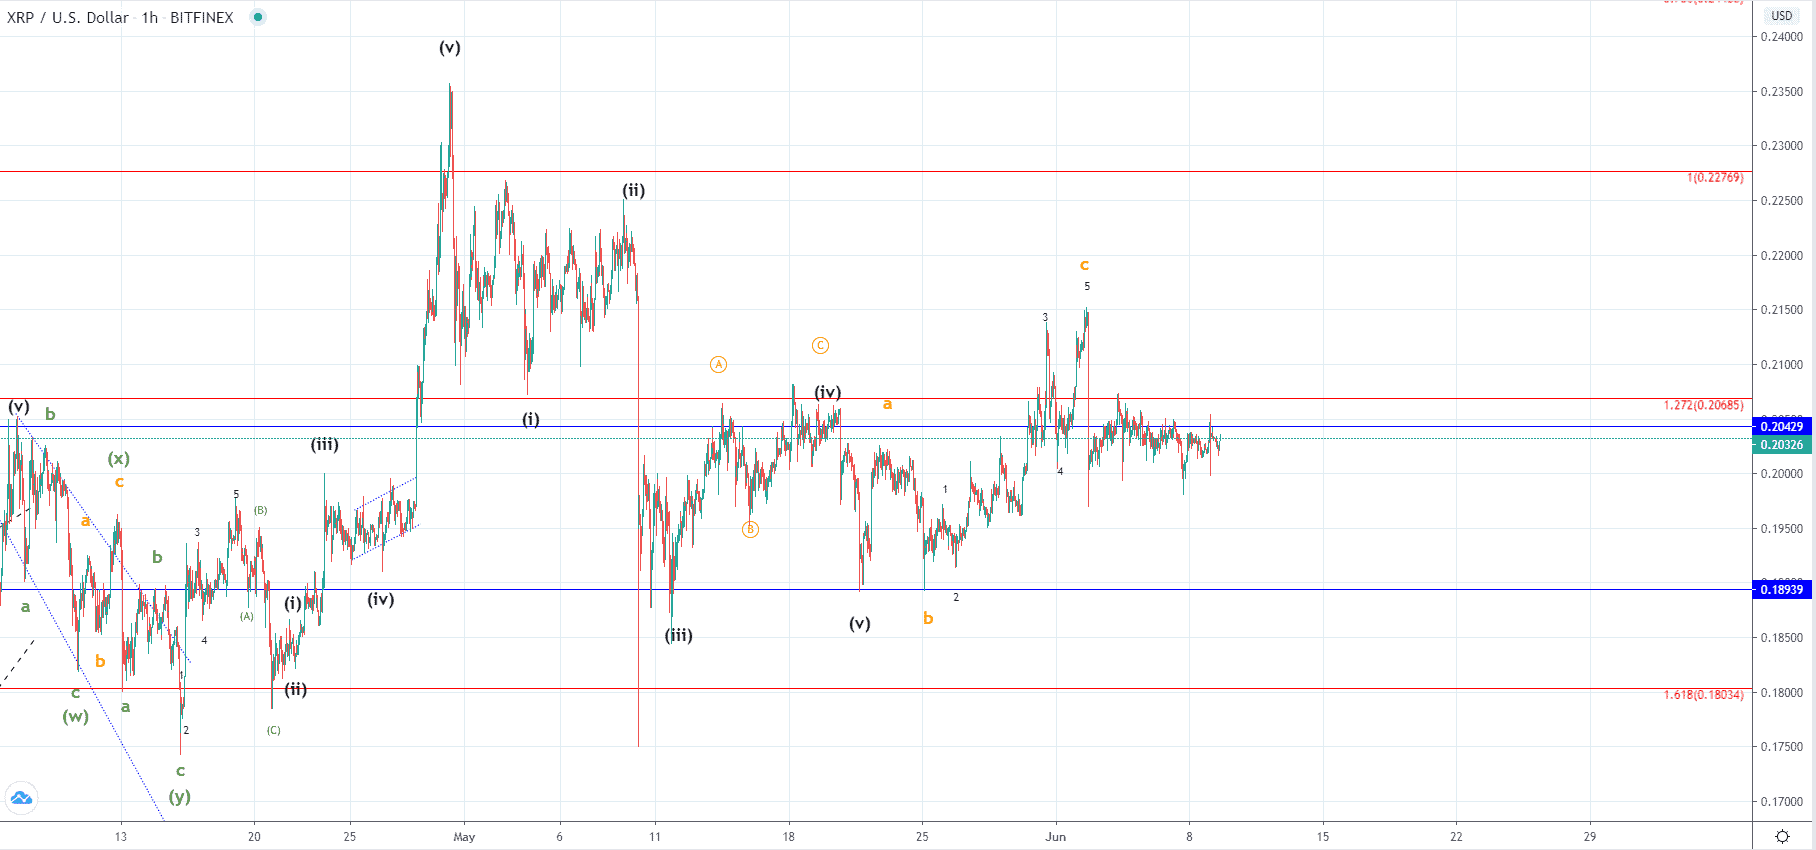
The price of Ripple has followed a similar pattern to that of Bitcoin as an impulsive spike to the upside was made last Tuesday after which we have seen a descending move below its starting point. The decrease seen was of around 8.42% coming from $0.215 to $0.197 but started increasing immediately after and came up to retest the 1.272 Fibonacci level.
The price could, in theory, make another attempt for a breakout to the upside above the mentioned Fib level but I won’t believe that the breakout will be made as the sellers pressure looks stronger at the moment.