BTC and XRP - Sideways range showing indecision
BTC/USD
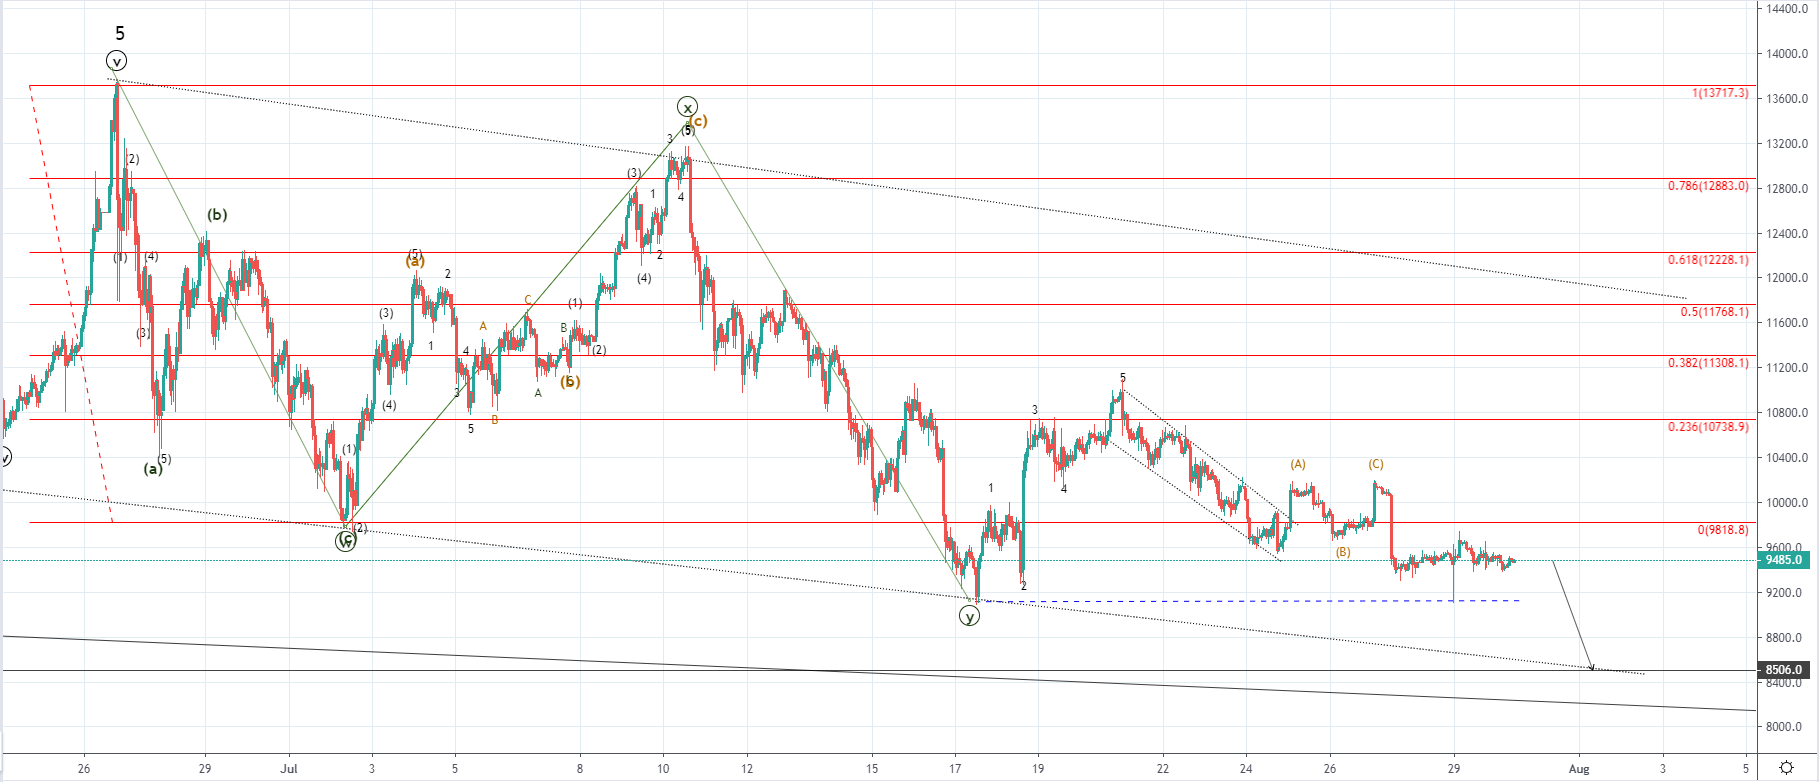
Last week the price of Bitcoin was $10641.1 at its highest point on Monday. From there we’ve seen the price decreasing until Wednesday when the price started recovering and came to $10168 which was again retested on Saturday but since the price failed to exceed the prior high another shart downfall has been seen to $9367 on the same day.
Since then the price has been hovering in a horizontal range between the Saturday’s low and $9580 but the price spiked to the downside and retested the prior low on a quick spike after which a retest of the 0 Fib level has been made. This horizontal range could be interpreted as a consolidative range after the price fell below the 0 Fib level and is likely a sign of indecision.
If we see another downside move I wouldn’t believe that it’s going below the still unconfirmed descending trendline and the intersection with the horizontal level at $8506 but its equally possible that the price would be headed upward from here as this downtrend from the 20th of July could be the 2nd wave out of the next structure to the upside as the WXY correction ended.
The price of Bitcoin most likely ended its 5th wave to the upside of the Minor degree on the yearly high which is why we are seeing a corrective downside move as the first wave out of the same degree starting downtrend but this could also be a prolongation of the corrective decrease after the uptrend continues.
Considering that the price of Bitcoin has been in an upward trajectory since 15th of December we are most likely seeing the first formation in the entering bearish period so in either way even if the price is to increase from here I would be expecting further decrease below $8500 in the upcoming period.
XRP/USD
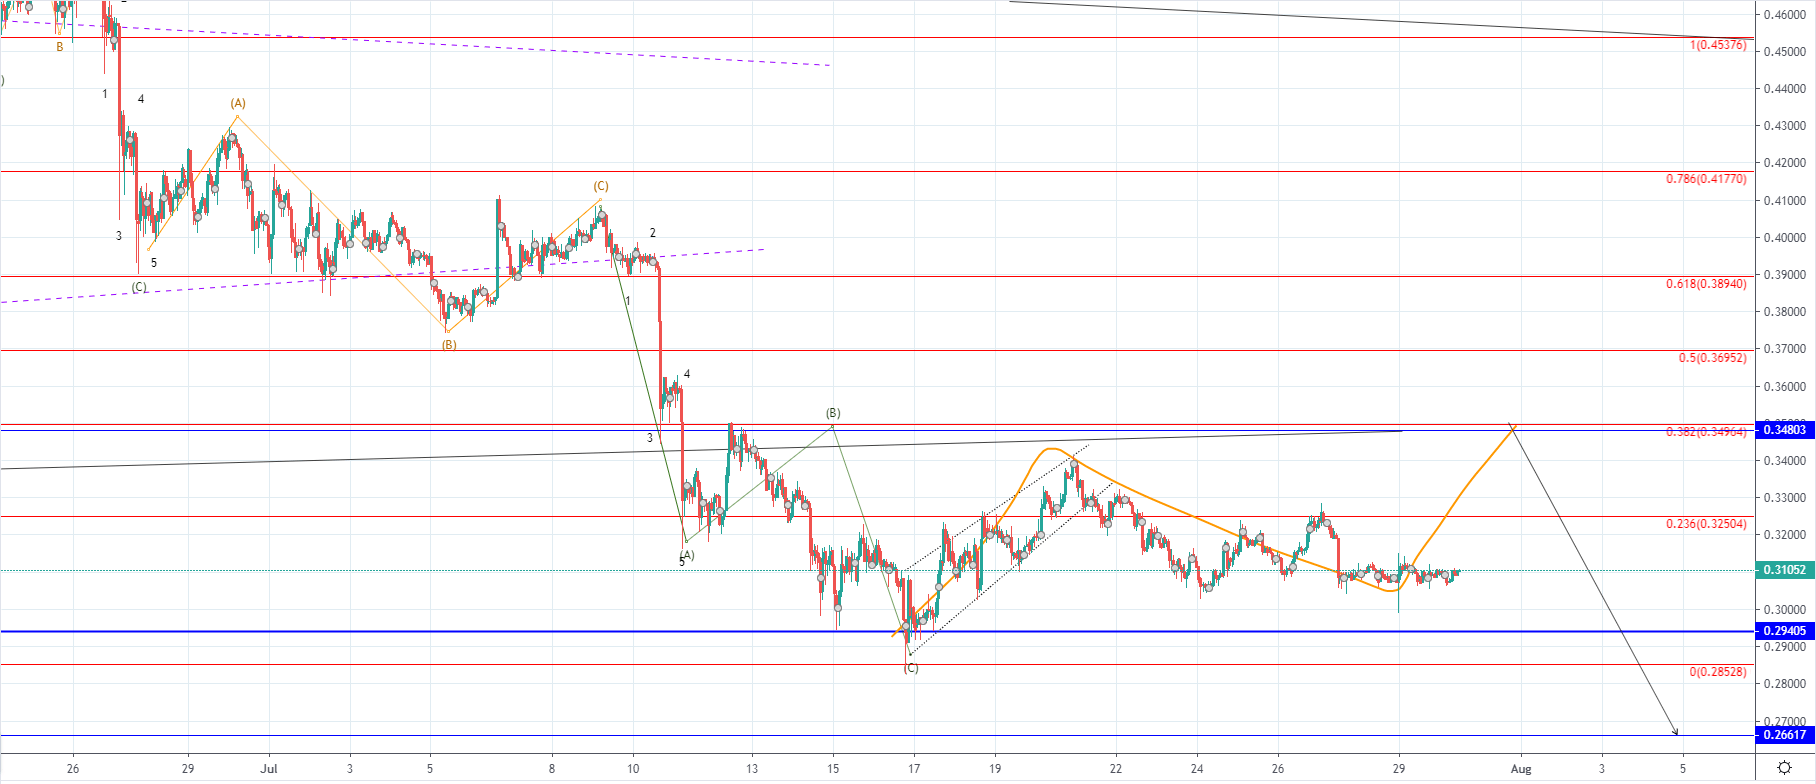
The price of Ripple has been following the chart pattern of Bitcoin as like in the case of Bitcoin we’ve seen a horizontal range after an attempt for a recovery ended as a failure with the price decreasing over the weekend. From last weeks high at $0.3303 we have seen a decrease to $0.305 at its lowest point after which recovery to the 0.236 Fib level occurred but the price got rejected by the resistance found there and again fell to the mentioned low level.
This is why I would be expecting another increase from here to the 0.382 Fib level as another retest of the significant resistance point before another downside move to the lower horizontal support level. The likelihood of a breakout from both sides is equal at this point which is why I don’t believe that we are to see a decisive move soon, instead, more likely we are going to see further sideways movement in the upcoming period.