BTC and XRP - Strong bullish momentum seen
BTC/USD
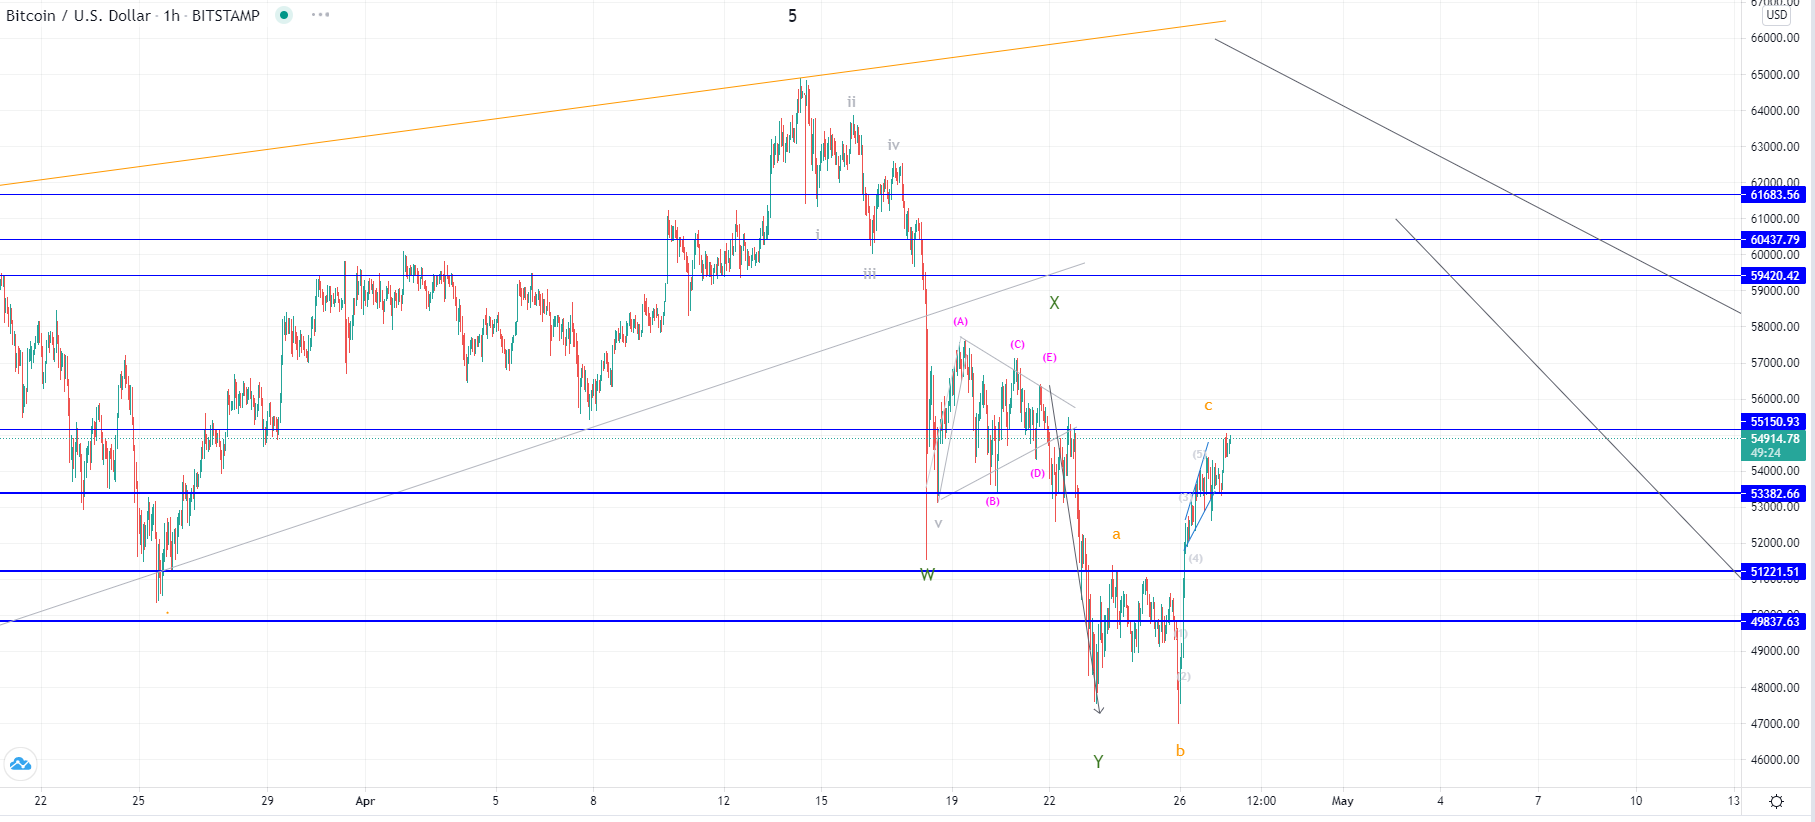
The price of Bitcoin has been decreasing from the 14th of April when it reached $64,735 at its highest point. From there we have seen a decline of 27.56% measured to its lowest point made on the 25th which was at $46,896. A recovery of 16.8% followed as the price came up to $55,000 area on its highest point of the week so far. Currently, it is being traded slightly lower but is still in an upward trajectory.
On the hourly chart, you can see that the price made a three-wave decrease from the 14th of April which was most likely an WXY correction of the higher degree count. It ended with a double bottom with an impulsive rise that followed.
This could be an early indication that the price decrease ended and that we are seeing the development of the next starting impulse. However, we could have seen another corrective ABC to the upside from the 23rd which would be the corrective WXY continuation wave leading into a lower low.
We are now seeing the price looking for support above the significant horizontal support at $53,369 with a minor triangle forming, so from its breakout direction, we are to see which scenario gets validated.
If we see a breakout to the upside it could mean that the starting impulse is on the move, but if the price starting impulsively moving to the downside it could be an indication that the corrective ABC to the upside ended.
XRP/USD
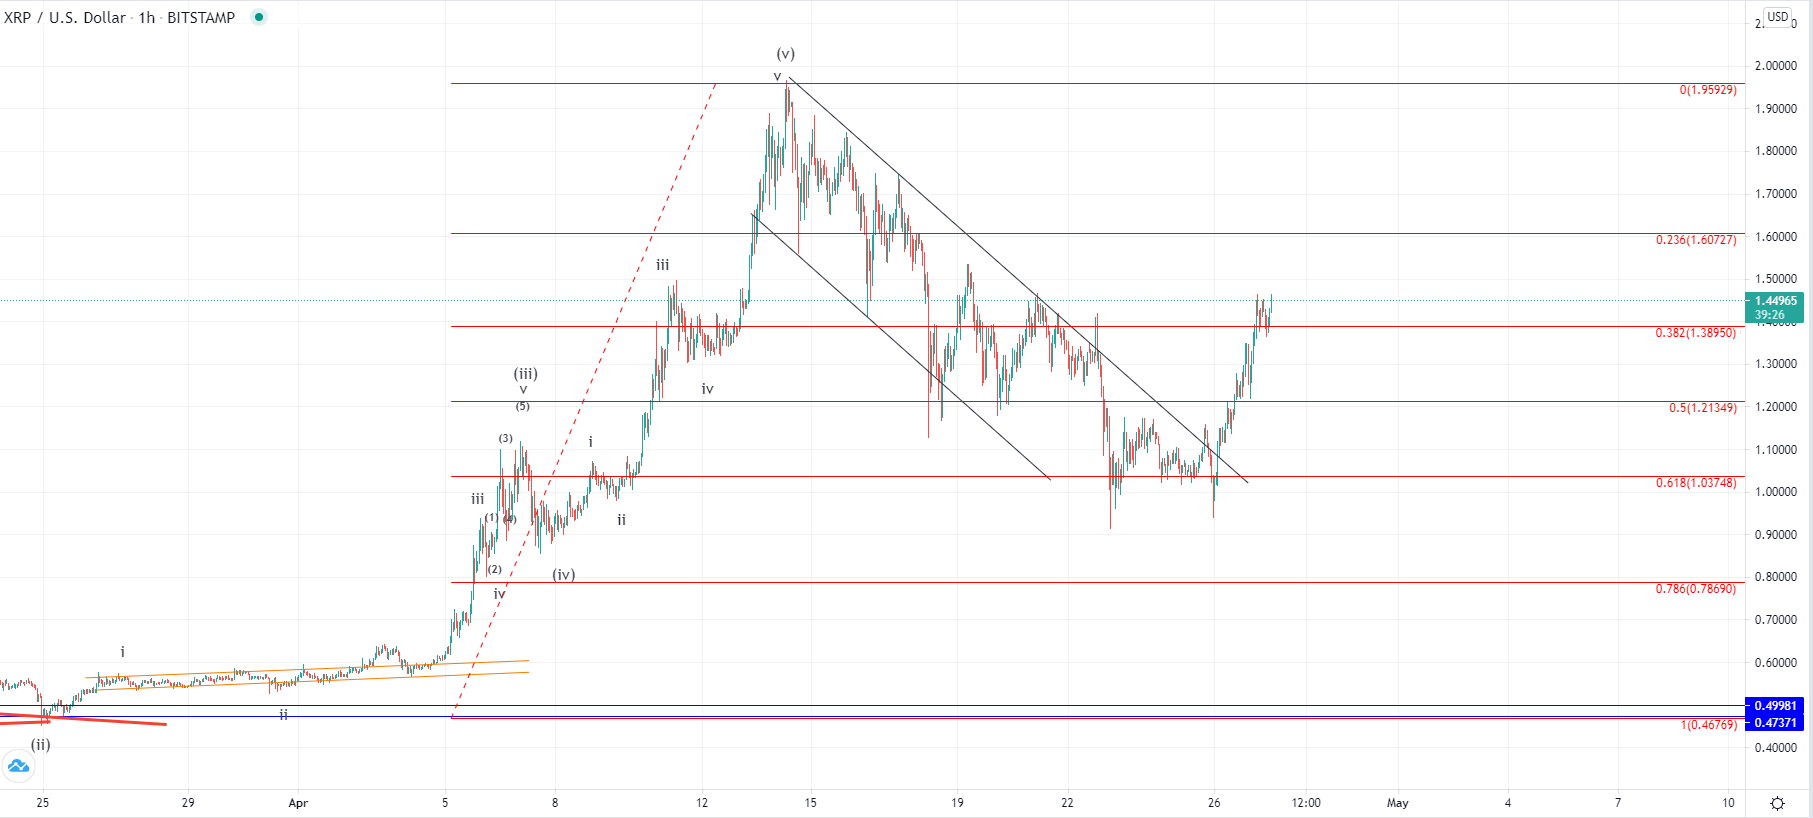
The price of Ripple has increased by 55% from yesterday’s low at $0.94288 as it came up to $1.4617 at its highest point today. It is still moving to the upside with strong bullish momentum.
Looking at the hourly chart, you can see that the price made a breakout from the descending channel in which it was since the 14th of April and fell down to the 0.618 Fibonacci level. This could indicate that we have seen the completion of the corrective move after a five-wave impulse that pushed the price up to $1.959 area. If this is true then we are seeing the development of the first wave from the upward impulse that has started developing from yesterday’s low.
In that case, we are shortly to see a pullback that has to maintain a higher low compared to yesterday’s one and would preferably end above the 0.5 Fib level at around $1.213. This is so because the upward impulse has shown strong momentum and in the expected retracement it shouldn’t go as deep. However, this upward move could be another corrective sub-wave of the higher degree count considering that it made a significant rise which usually isn’t the case with the starting wave of the five-wave impulse. This is why we are going to evaluate the possibility of either scenario from the expected pullback, its momentum and depth.
This forecast represents FXOpen Markets Limited opinion only, it should not be construed as an offer, invitation or recommendation in respect to FXOpen Markets Limited products and services or as financial advice. Cryptocurrency CFDs are not available to trade in all jurisdictions.