BTC and XRP - The prices recover but for how long?
BTC/USD
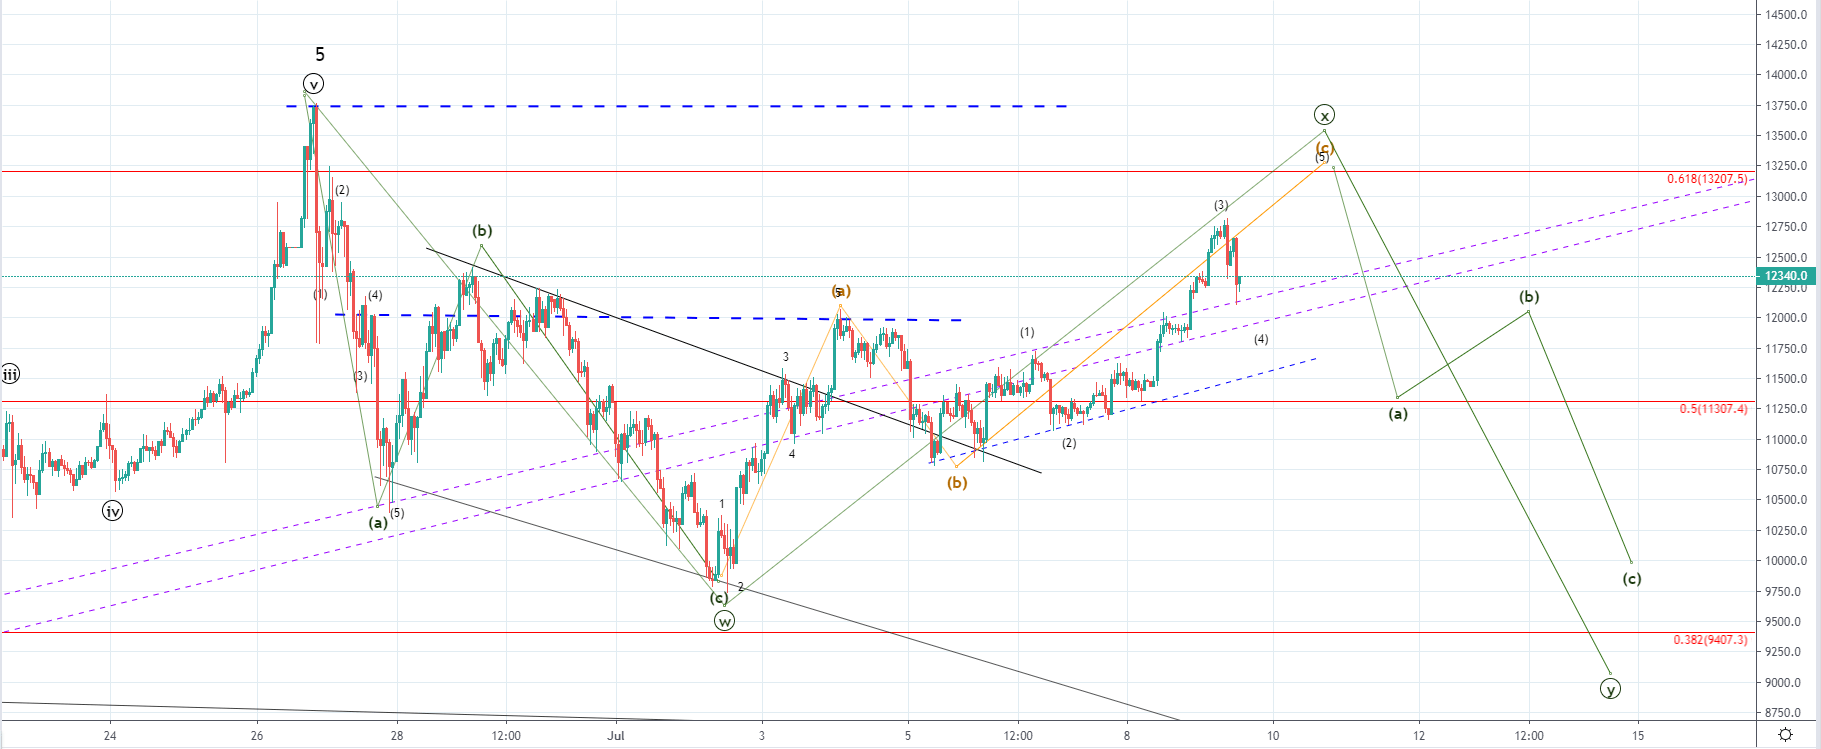
From last Tuesday when the price of Bitcoin came down to $9833 at its lowest point we have seen an increase of 30% measured to the highest point the price has been today which is at $12814. The price is currently being traded at $12348 and even spiked further down to $12119 at its lowest point today.
As the price found support around the descending resistance level it started increasing again. I believed that the price is going to retest the upper ascending level before continuing to move to the downside again as the descending channel which started forming form 28th of June looked like it could be the 2nd wave out of the higher degree correction. But as the price increased with strong bullish momentum above the ascending range we could be seeing another ABC correction to the upside which would be the wave X out of the mentioned higher degree correction.
Another possibility would be that the ABC to the downside which ended last Tuesday was the end of the correction with the 30% increase seen after being the start of the next impulsive move to the upside, but I don’t believe that’s likely because according to my count the 5th wave of the Minor count ended on the yearly high at $13740.
As the price is in an upward trajectory in the upcoming period I would be expecting an interaction with the 0.618 Fib level or a retest of the yearly high before another downfall potentially below the 0.382 Fib or slightly above it, to around the vicinity of the last Tuesday’s low.
XRP/USD
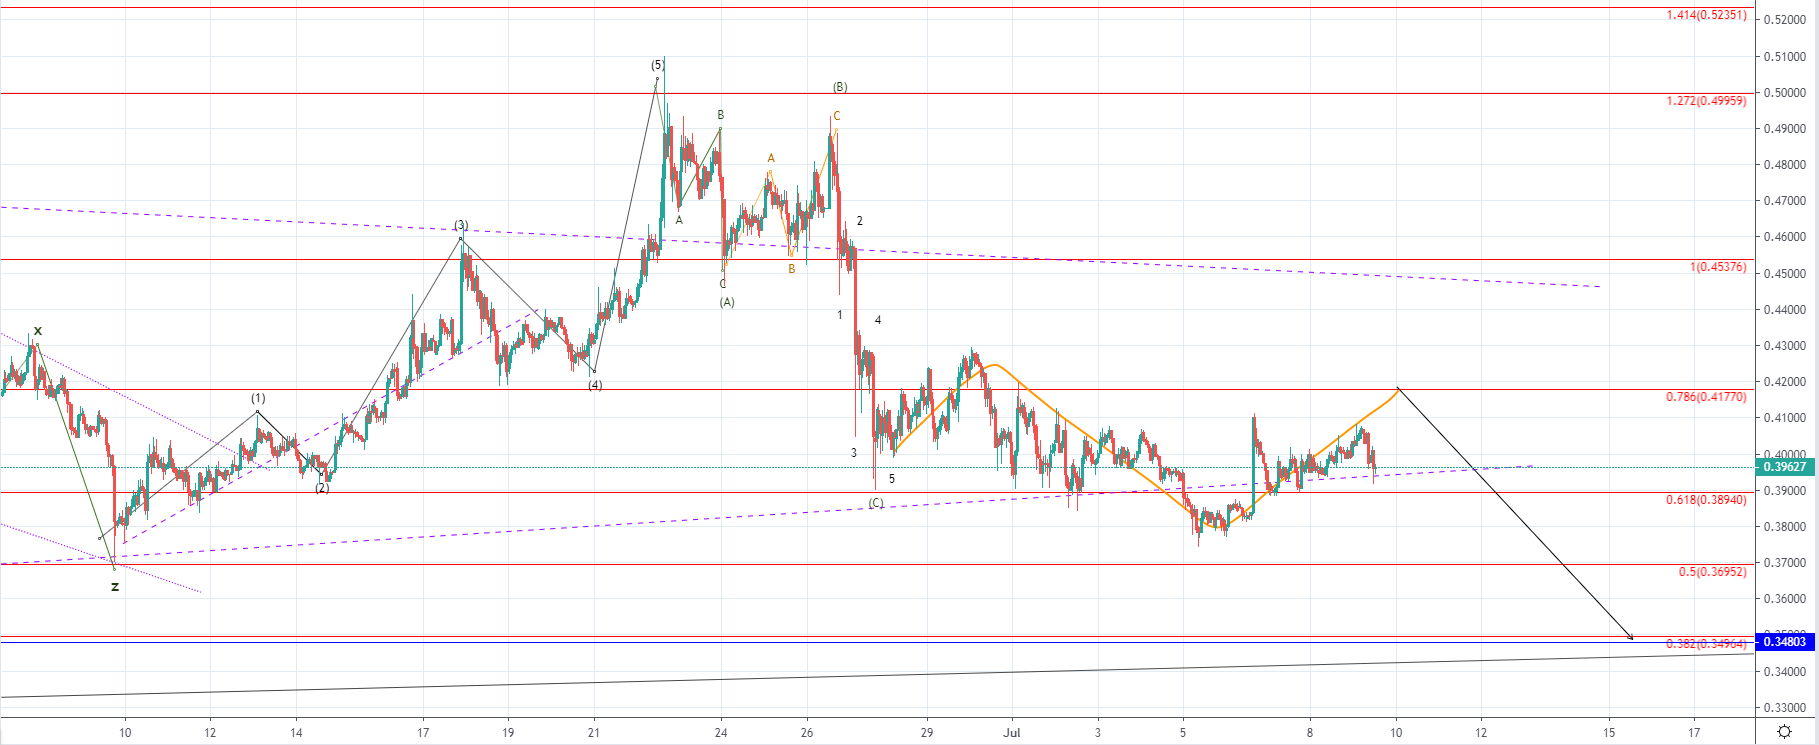
From Friday’s low at $0.37812 the price of Ripple has increased by 7.71% measured to its highest point today which was at $0.4072 but fell down to $0.39591 where it’s currently being traded.
A further increase would be expected for interaction with the 0.786 Fib level as we are most likely seeing a three wave correction to the upside which is set to end on a lower high compared to the one which ended slightly above the 0.786 Fibonacci level on the 30th of June. As we’ve seen the completion of the five-wave impulse as an interaction with the 1.272 Fib level and an ABC to the downside this structure is most likely the past of the same correction of a higher degree and would, in that case, be its 2nd wave which is why after an interaction with the 0.786 level I would be expecting another downfall to the downside at around the intersection of the lower confirmed ascending trendline and the 0.382 level.