BTC increasing significantly while XRP is moving sideways
BTC/USD
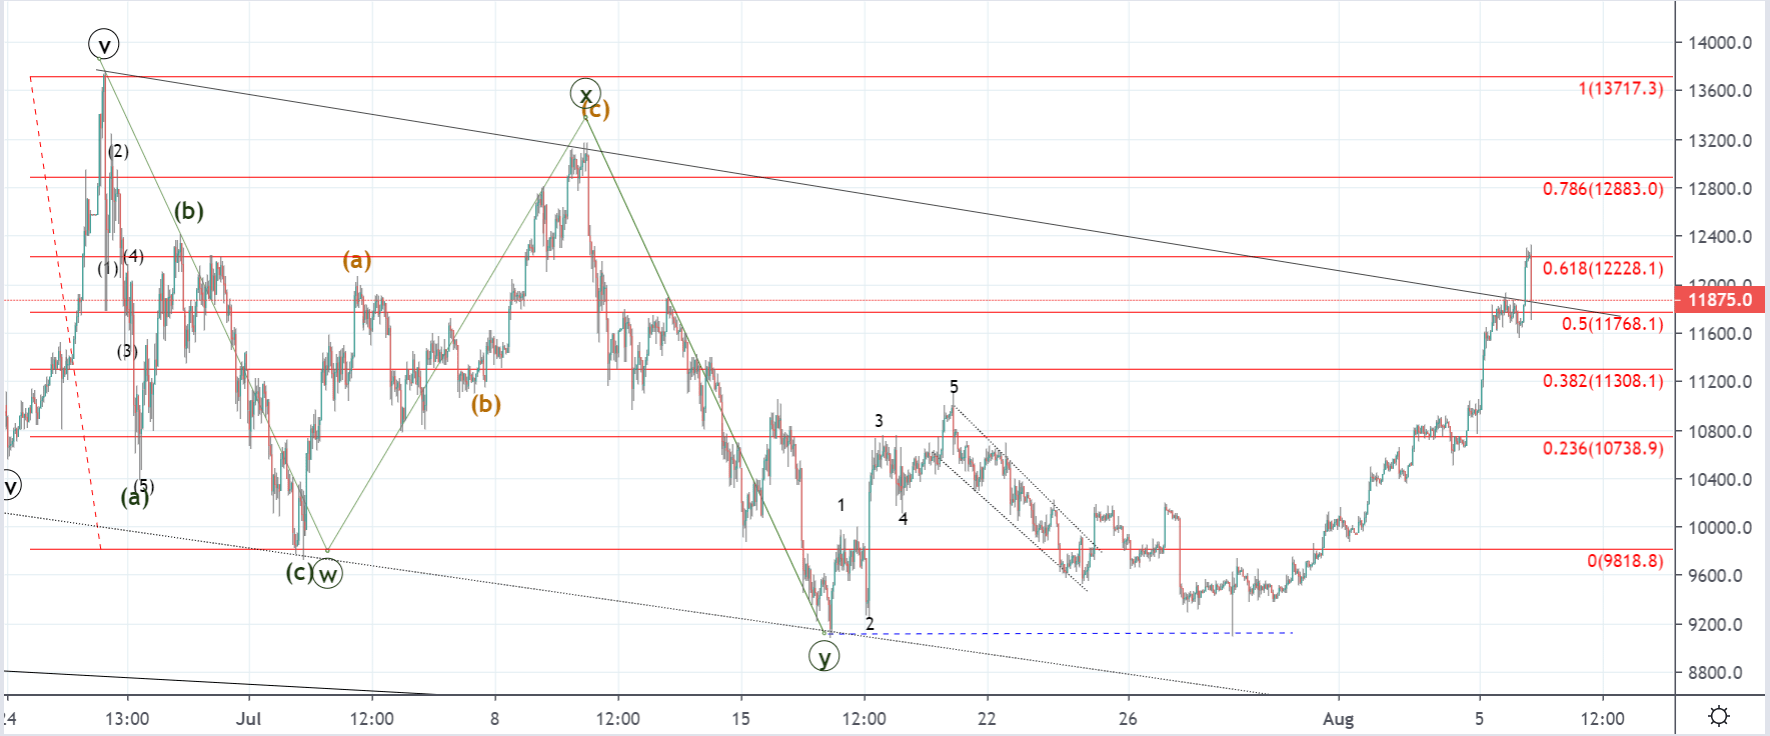
From 30. of July the price of Bitcoin has increased by 30.92% as it came up to $12317.5 at its highest point coming from $9407. As it encountered resistance a steep downfall has been seen with the price currently being traded at $11875.
If the price finds support on the broken resistance level further increase could be expected to the next Fib level at $12883 but considering the amount of increase in one go and the vicinity of the resistance point, I don’t believe that’s likely.
More likely we are to see the downfall continuation as the price reached overextension and has moved parabolically to the upside. A retracement could end on the 0.382 Fib level if the breakout is to occur above the descending channels resistance, but if the price falls below it the attempt is most likely to end as a fakeout.
Prior to this recovery, we’ve seen the completion of the three-wave correction which is why the next five-wave move a retracement after in conjunction with the last increase could have been the first three waves out of the next five-wave impulse to the upside. But another possibility would be that the recovery ended on a three-wave move retesting the descending channel’s resistance in which case it should be viewed as the WXY correction prolongation.
This would soon be verified by the price action movement in the form of a breakout or a fakeout which is why the 0.382 Fib level serves as an indication point.
XRP/USD
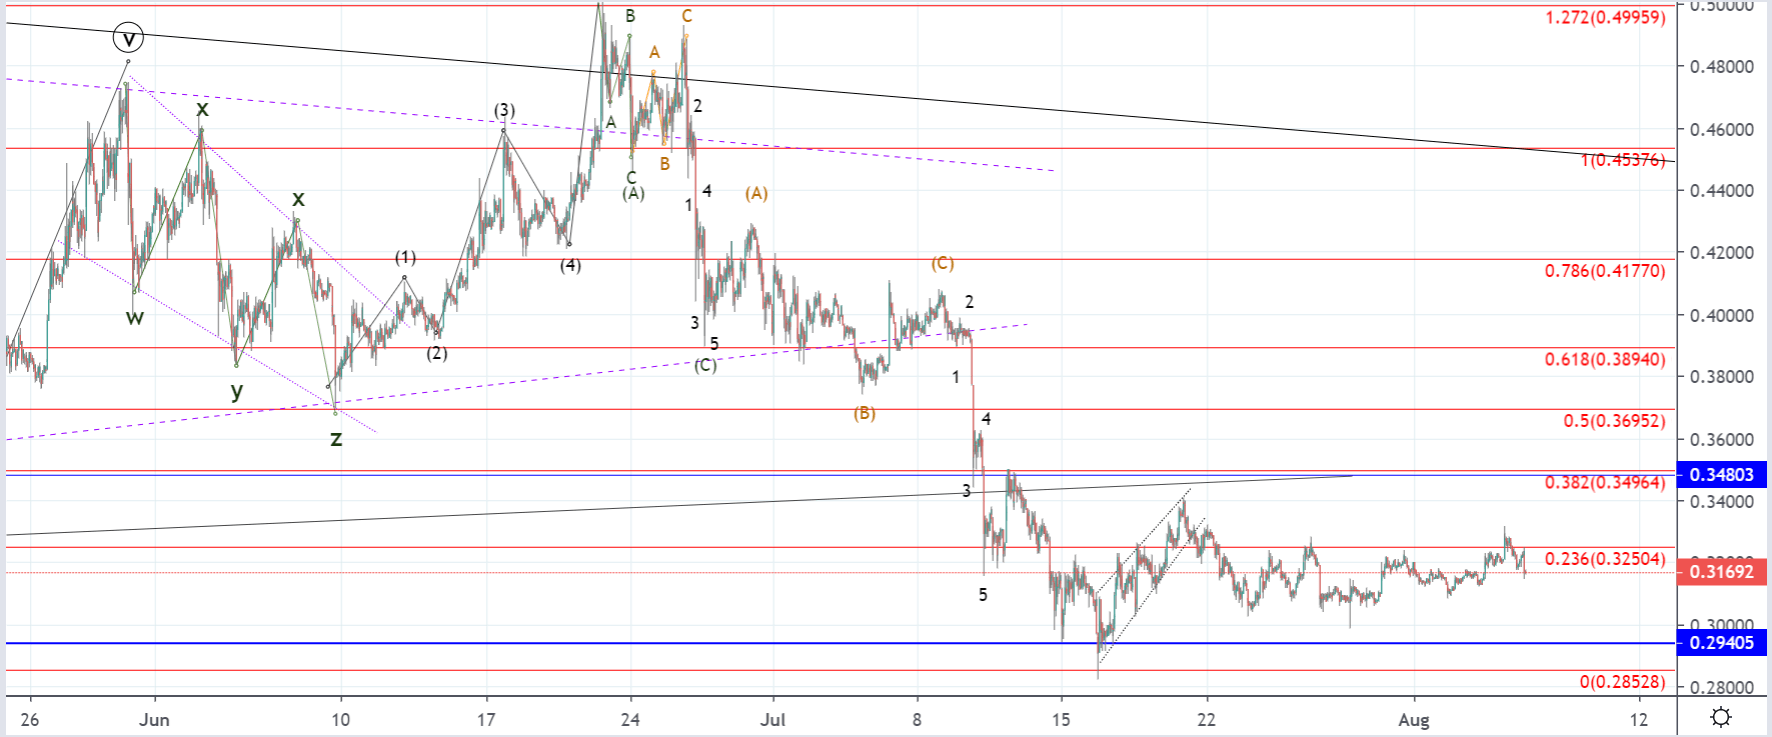
The price of Ripple has been moving sideways since 24. of July when it was sitting around $0.304 at its lowest point. Today the price came up to $0.32882 at its highest point but is currently being traded at $0.31692 as it encountered resistance.
From 30. of July the price of Ripple has been in a slight upward trajectory but it only recovered by 6.94% measured to its highest point today. The recovery might continue if the price finds support on the higher low which could be on the current retest of the minor horizontal resistance level from the sideways range out of which the price is attempting to break out to the upside.
As the price came down to the 0.29405 level previously, retesting it for support I was expecting a potential start of the next five-wave impulse wave to the upside but we haven’t seen the price behaving impulsively which is why we could see another retest of the mentioned significant horizontal support level before a significant recovery could start.