BTC/USD and XRP/USD - bullish movement is corrective, more downside expected
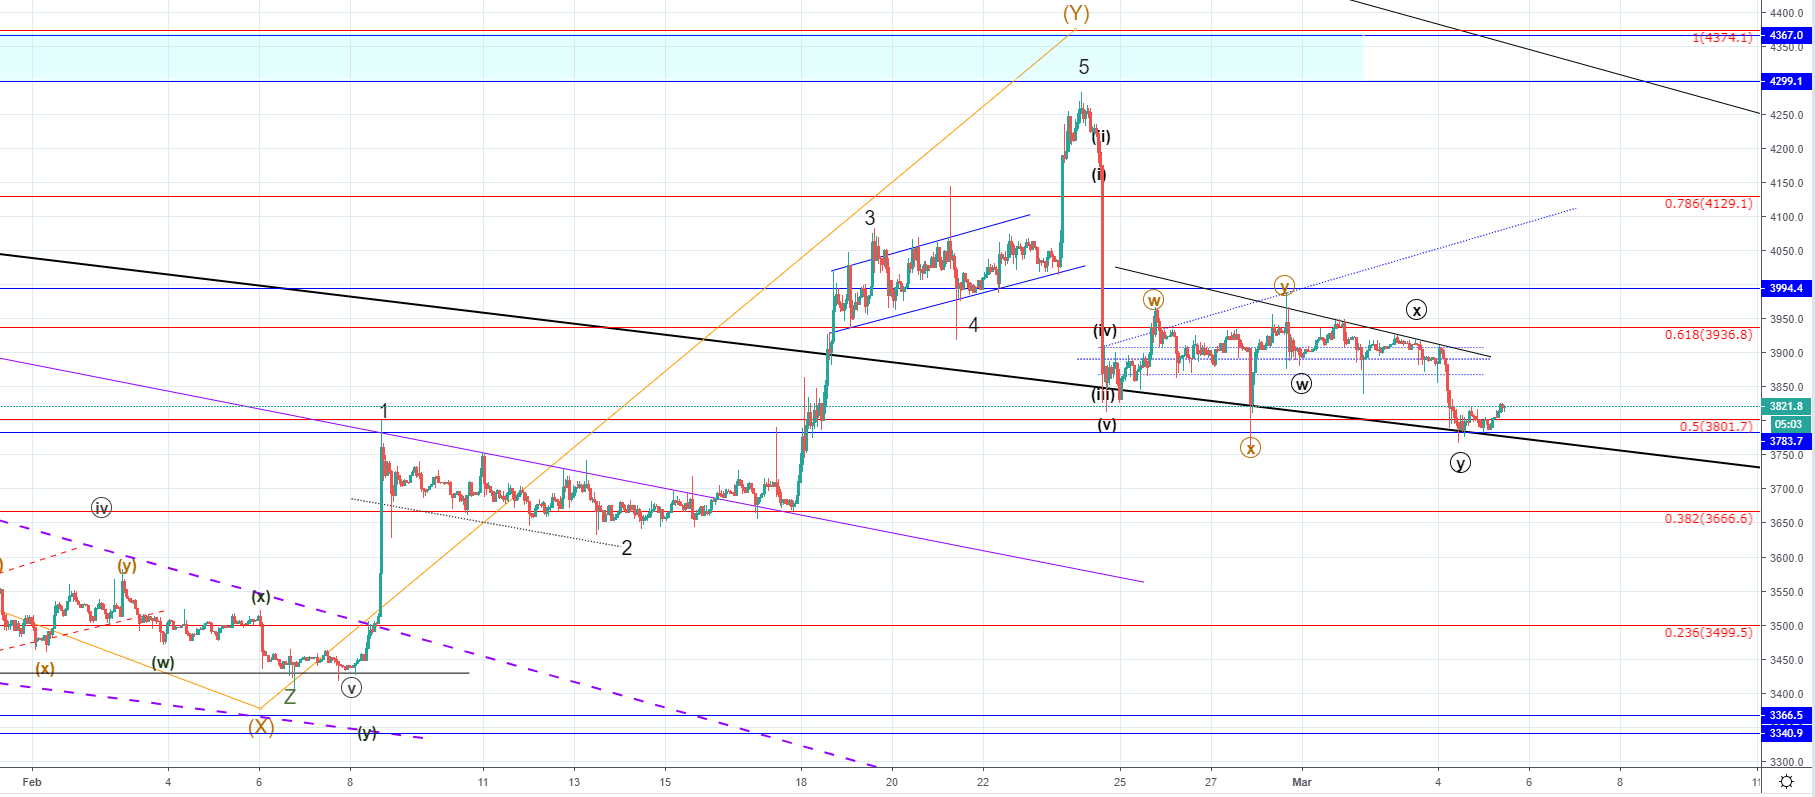
BTC/USD
From last week’s analysis, when the price of Bitcoin was $3925, we have seen stagnation as the price was hovering sideways around those level until yesterday, when another decrease of 3.12% was made from $3906 to $3784.
Looking at the hourly chart, we can see that yesterday’s decrease was a breakout from the horizontal range in which the price moved sideways, consolidating after the initial drop of over 10%. The price fell to the most significant support level which is the baseline support since the start of the bear market and has found support there as it retested the level twice before going in an upward trajectory again.
Now, when the price is above the 0.5 Fibonacci level and the baseline support, we are most likely to see further upside movement, but according to my count, it would be the final Minute correction to the upside before the price starts moving down again for a breakout to the downside. This is expected due to the fact that previous to the formation of the horizontal range we have seen an impulsive move to the downside, which is most likely to continue after the period of consolidation ends as the Intermediate Y wave ended and we are most likely seeing an impulsive move to the downside as a trend continuation.
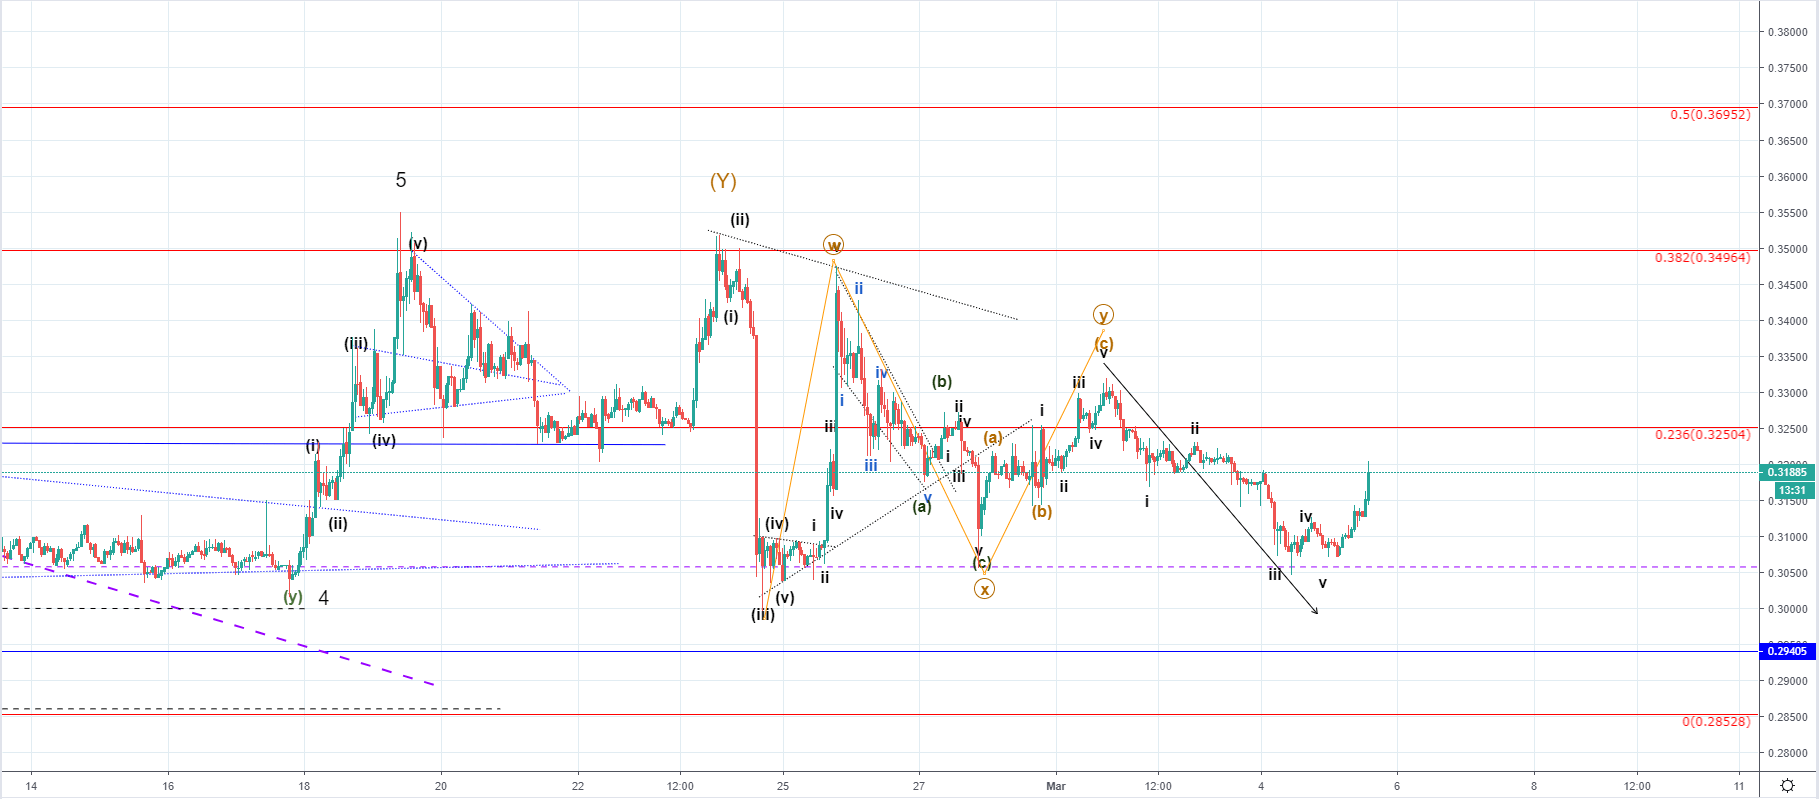
XRP/USD
The price of Ripple has decreased by 4.84% over the course of the last seven days as it came down from $0.33561 on Tuesday to the current level at $0.31885.
On the hourly chart, we can see that the price of Ripple is once again in an upward trajectory as it came down to its horizontal support on a 5-wave move. Like in the case of Bitcoin I believe that this upside movement is correctional as previously the price of Ripple broke below the 0.236 Fibonacci level, which served as support, and we could see now the price back to its vicinity for a retest of resistance.
Wave structure implies that the current increase is impulsive, so the previous 5-wave move wasn’t the beginning of the next impulse wave to the downside and is most likely the correction inside the Minute WXY and the current increase could be the Y wave as the previous movement to the downside could be the wave X. If this is true, then we could see the price of Ripple go above the 0.236 Fibonacci level before further downside, although now very likely.