BTC/USD and XRP/USD Fake-out
BTC/USD
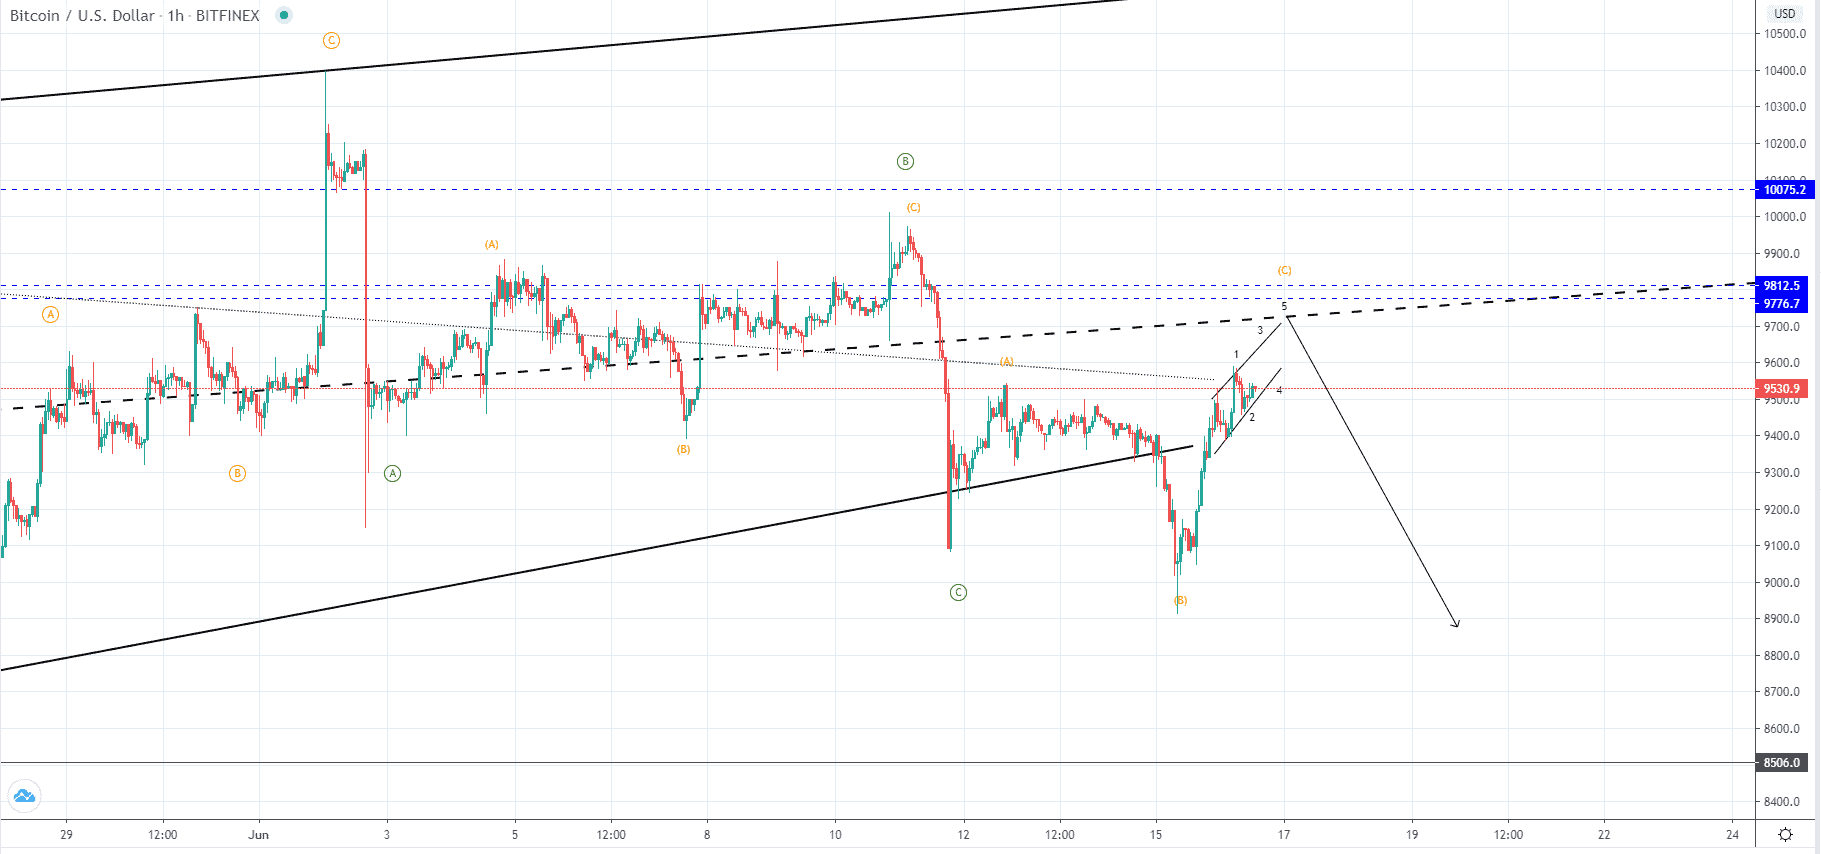
Yesterday the price of Bitcoin has fallen to $9040 and even spiked a bit further to the downside below the $9k mark making a lower low compared to Friday’s one and has attempted to break out the ascending channels support level but spiked back up inside its territory reaching $9573 at its highest point today.
Interaction with the midpoint ascending interrupted trendline could be expected before the end of this increase inside the ascending channel for a retest of resistance, but if this increase was corrective in nature and was another upward ABC correction we are to see a proper breakout after it’s completion leading for another lower low. If this was a C wave of lower degree count then another three-wave corrective movement could be expected to the downside potential to the $8500 area which would lead this correction as a higher degree WXYXZ count which is what I would be expecting.
But another possibility would be that we have seen the completion of the three-wave higher degree correction (WXY) on yesterday’s low in which case the spiky upside move would be the start of the next impulse five-wave move to the upside. As significant resistance level is soon to be interacted with, from the depth and the momentum of the expected downside move we are to evaluate these possibilities.
XRP/USD
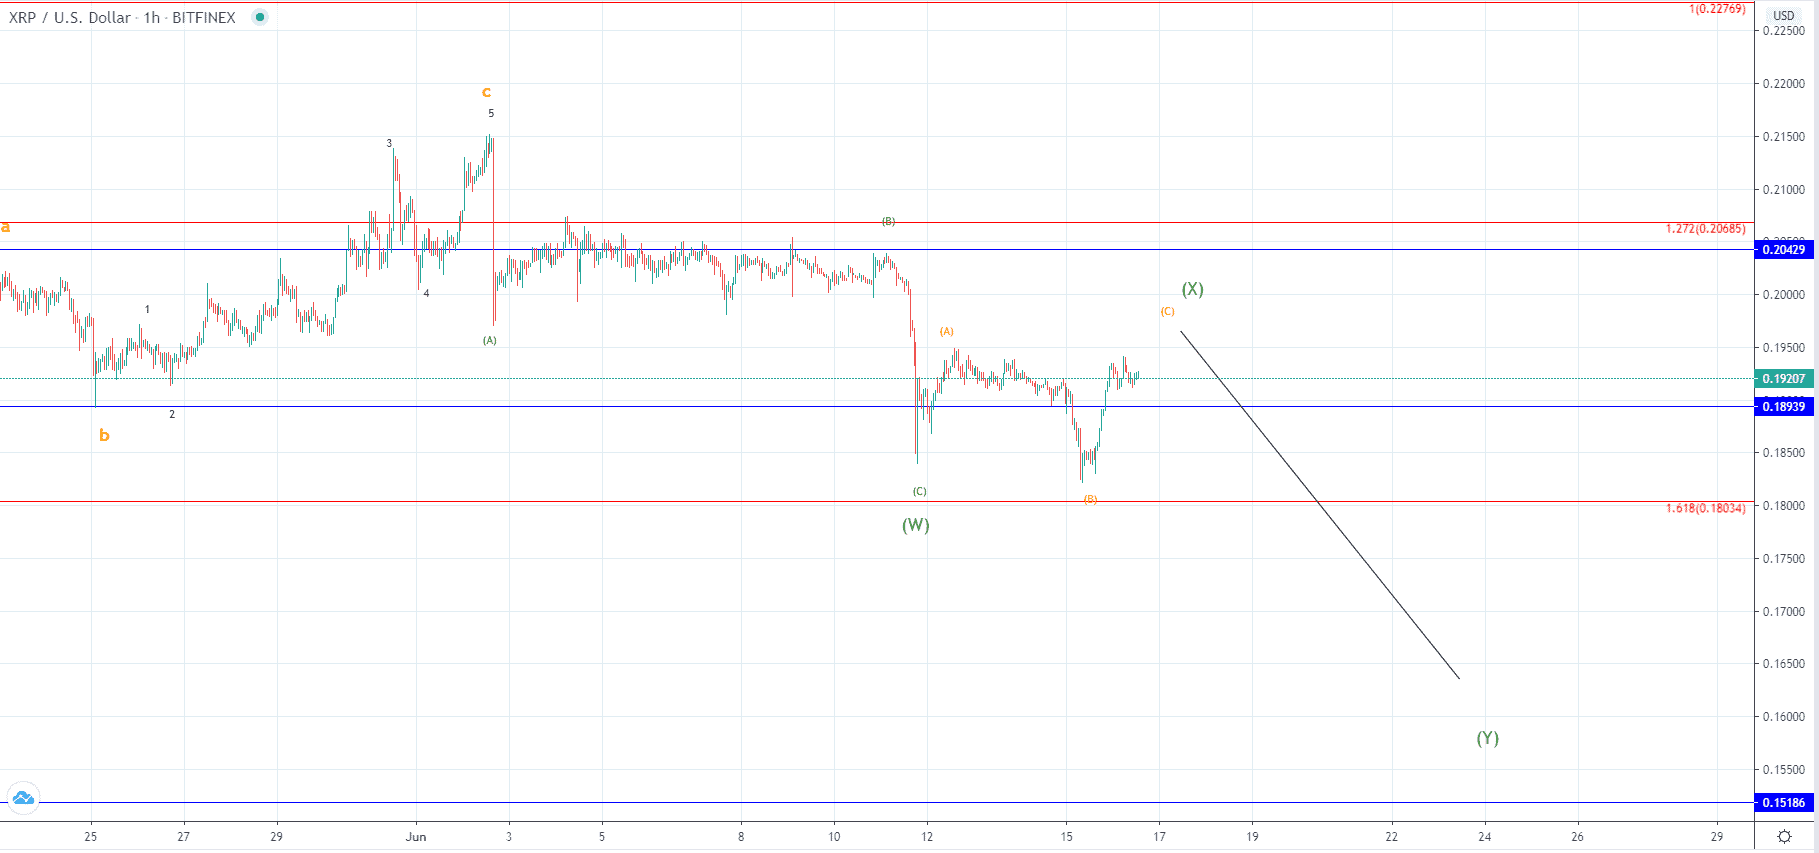
The price of Ripple has increased by 6.29% since yesterday’s low at $0.1823 as it came up to $0.19384 at its highest point today. Currently, it is being traded slightly lower but is still in an upward trajectory slightly moving sideways.
As on the 2nd of June, we have seen the start of the impulsive move to the downside which led the price into a 14.23% depreciation the one we are seeing now is most likely a retest of the $0.19 area support now serving as resistance before the downtrend continues.