BTC/USD and XRP/USD - more downside expected
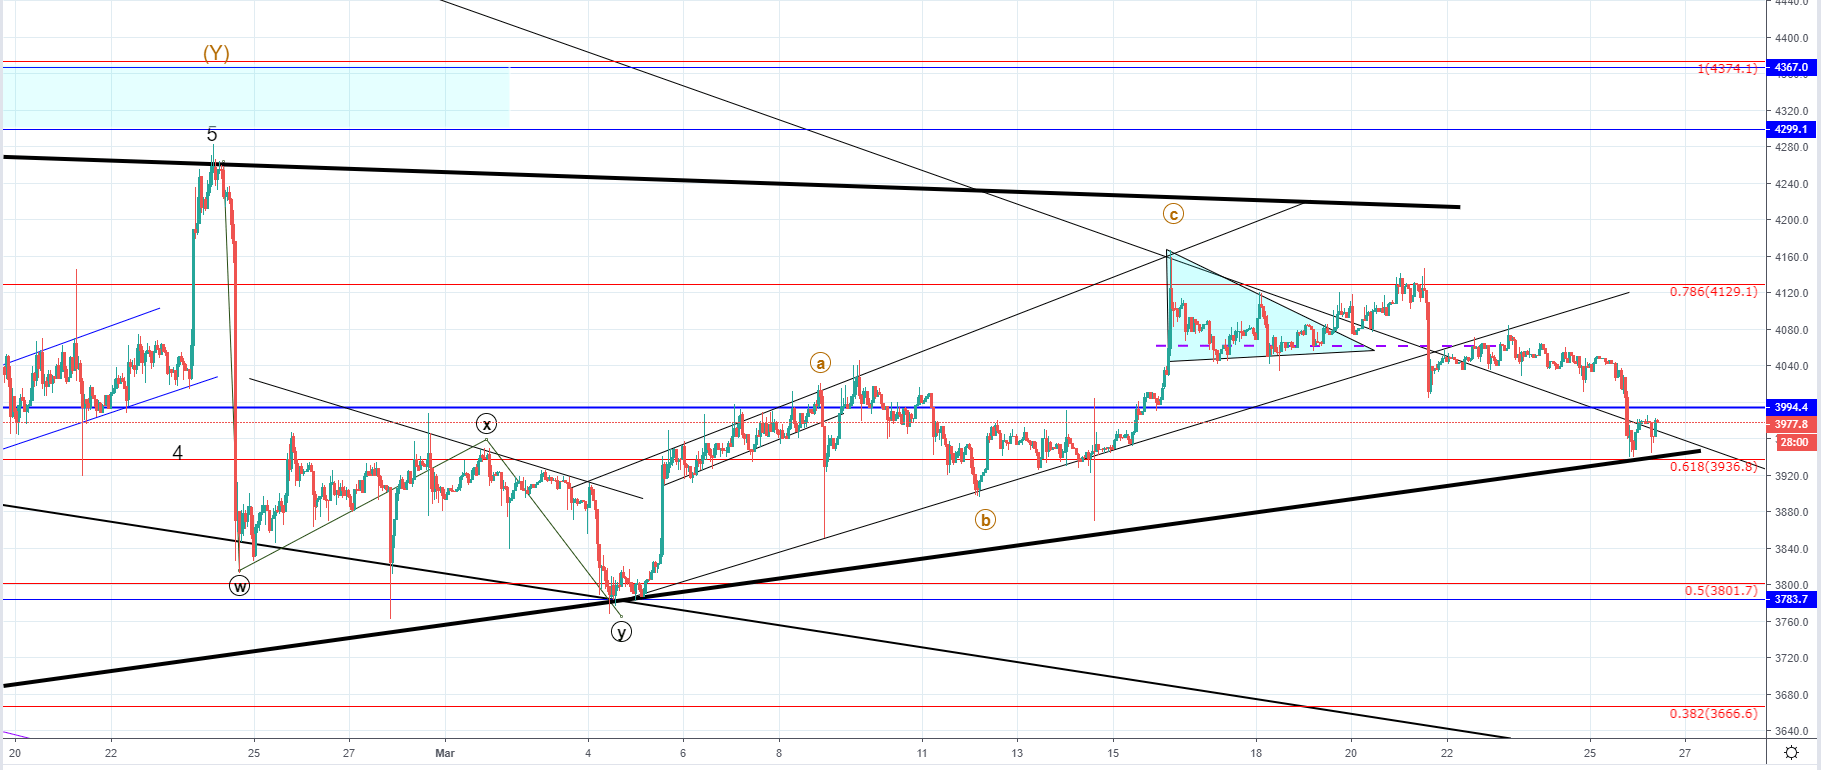
BTC/USD
Last week the price of Bitcoin was in a minor in which the price increased by 2.17% – coming from $4057 at its lowest point on Monday to $4145 at its highest spike on Thursday. From there the price of Bitcoin started decreasing fast as it came down to $4004 in a matter of hours which indicated that the sellers are starting to gain control as the price previously came up to the vicinity of the prior high level and found resistance there again.
On the hourly chart, you can see that the price of Bitcoin broke down below the ascending trendline which was the minor trendline from 4th of March and retested it from the downside for resistance last Saturday which cause the price to start moving in a downward trajectory once more.
As the price continued its downward trajectory over the weekend, yesterday we saw another impulsive decrease down to the next ascending trendline intersection with the 0.618 Fibonacci level at $3936 which serves as a support point. Now that the price found some temporary support there. It is struggling to make a recovery as it looks from the last couple of hourly candles. The price fell below the falling wedge resistance line again so this movement around it couldn’t be interpreted as a breakout and is more like a retest of the descending resistance from both sides.
As the price of Bitcoin previously ended its ABC correction to the upside a downtrend was expected, but we are yet to see if the price starts moving impulsively to the downside further now as we are most likely seeing the start of the third correction to the downside.
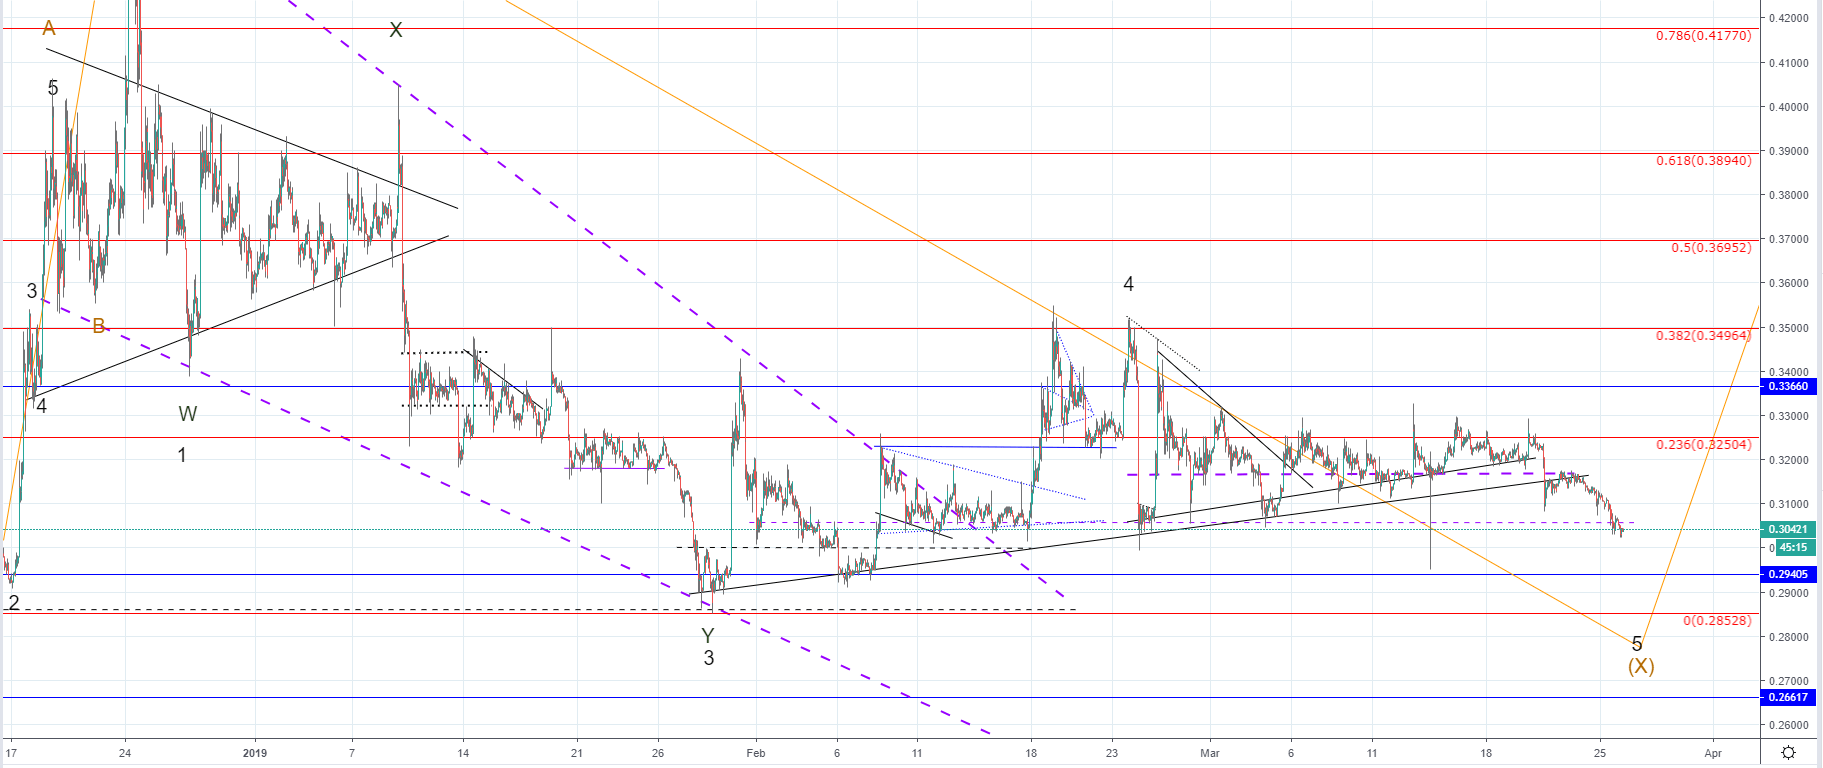
XRP/USD
From last Monday when the price of Ripple was $0.32242 at the open we have seen the price experiencing some sideways action at first until it came to $0.32648 on Wednesday which was the horizontal resistance of that range, and after a third attempt for the price to exceed those levels another rejection occurred, setting the price for more downside.
Looking at the hourly chart, you can see that the price spike above the 0.236 Fibonacci level. It served as resistance, but after entering the seller’s territory we have seen the price starting to move to the downside with strong momentum as the price fell by around 5.17% from Wednesday to Thursdays low breaking the lower ascending trendline which served as support. As the ascending trendline got broken a retest for resistance has been made confirming that the level now serves as resistance which was indicated by the rejection around $0.3168 where the intersection with the horizontal support also was.
The price is currently sitting below the minor horizontal support level from the prior range around its median line. Hence, considering the momentum shown I don’t believe that it is going to hold for much longer as its significance is low. Most likely we are going to see another downfall to the most significant support level to the downside which would be either around the $0.29405 or even lower to $0.28528.