BTC/USD and XRP/USD - more upside expected
BTC/USD
From yesterday’s low at $5275, the price of Bitcoin has increased by 5.95% as its currently being traded at $5580. The price was moving sideways over the weekend and was in a minor downtrend yesterday, but since it came down to the mentioned low levels it started increasing impulsively.
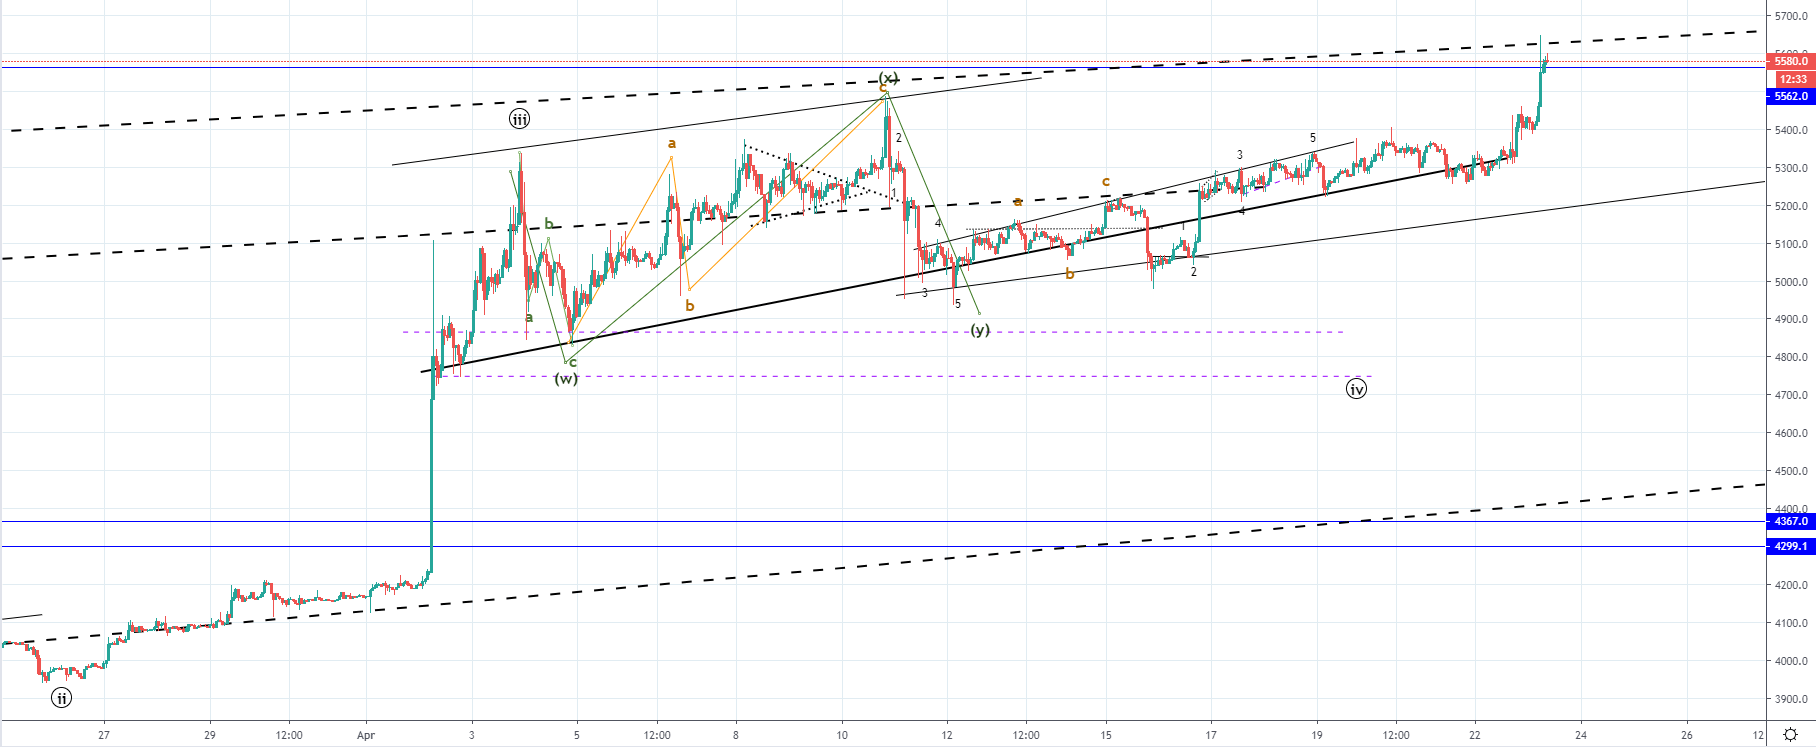
On the hourly chart, you can see that the price came up to its significant resistance levels out of which the first one is a horizontal and the other is an ascending one. Both are significant as they are the upper outline of the range in which the price action has been stuck in for quite some time now, and considering that they are intersecting around the current levels there we can assume that strong resistance would be found and judging by the looks of the current hourly candle the price might have already encountered it.
The price of Bitcoin has most likely ended its 4th wave correction, which started on the 3rd of April. We are now most likely seeing the start of another impulse wave to the upside which would be the 5th wave of a Minute count. This might not be true as the price still hasn’t broken out from the ascending range in which it was from 3rd of April, so having that in mind we can potentially see another pullback to the downside for a retest of support before a proper breakout to the upside occurs.
As the price hasn’t fallen below the median line on the previous minor ascending channel which is the support level from a higher, previous one we might see this happen if the currently seen interaction with the significant resistance level ends as a rejection.
If the price of Bitcoin continues increasing further and goes above $5640 I would consider that a breakout to the upside started, but if the price immediately starts decreasing from here we might see another decrease before a breakout.
XRP/USD
From yesterday’s low at $0.32119, the price of Ripple has increased by 2.73% measured to the level on which the cryptocurrency is currently being traded which is at $0.32988.
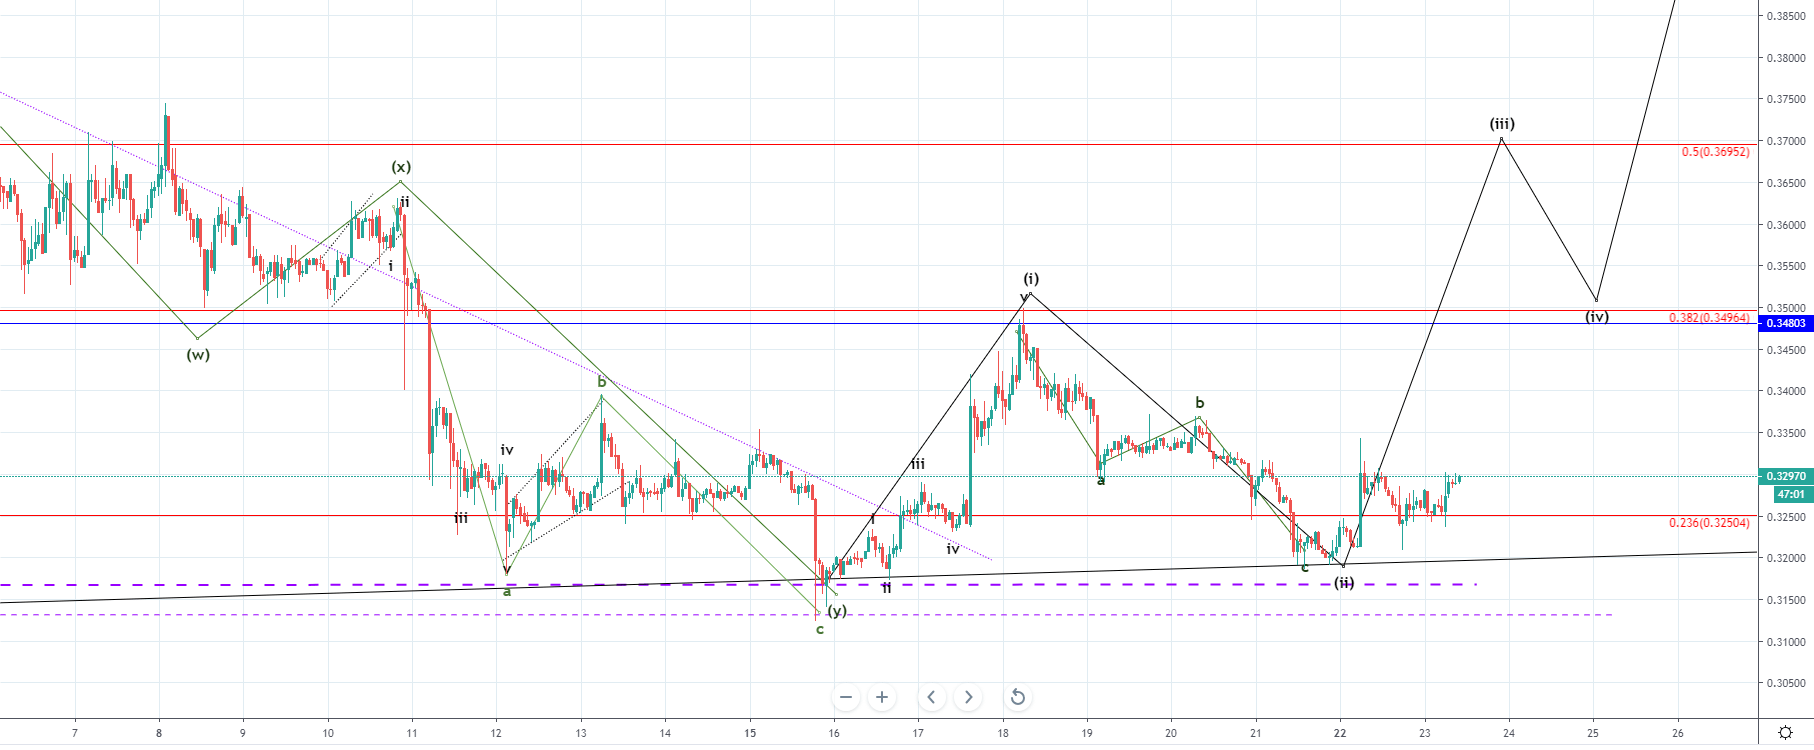
On the hourly chart, you can see that the price of Ripple came up to the prior high level where it most likely found resistance again as the price has been stopped out. The price managed to come above the 0.236 Fibonacci level yesterday and maintained to stay above it as the support was there. This is a good sign but since the increase was stopped out again at the same level as on yesterday’s high we might see the price back below the Fib level again. If that happens the price is most likely headed towards the retested support levels on which it previosly found support which is in price terms around $0.32.
The price more likely headed to the upside now that some support has been established on the previous downfall when the price interacted with the significant support levels and started increasing impulsively since, establishing support on the upper horizontal level. If the previous downfall was the second wave out of the higher degree five-wave impulse to the upside, now we are seeing the development of the third impulse wave which is set to exceed the 0.382 Fibonacci level as it was the ending point of the 1st wave.