BTC/USD and XRP/USD moving sideways
BTC/USD
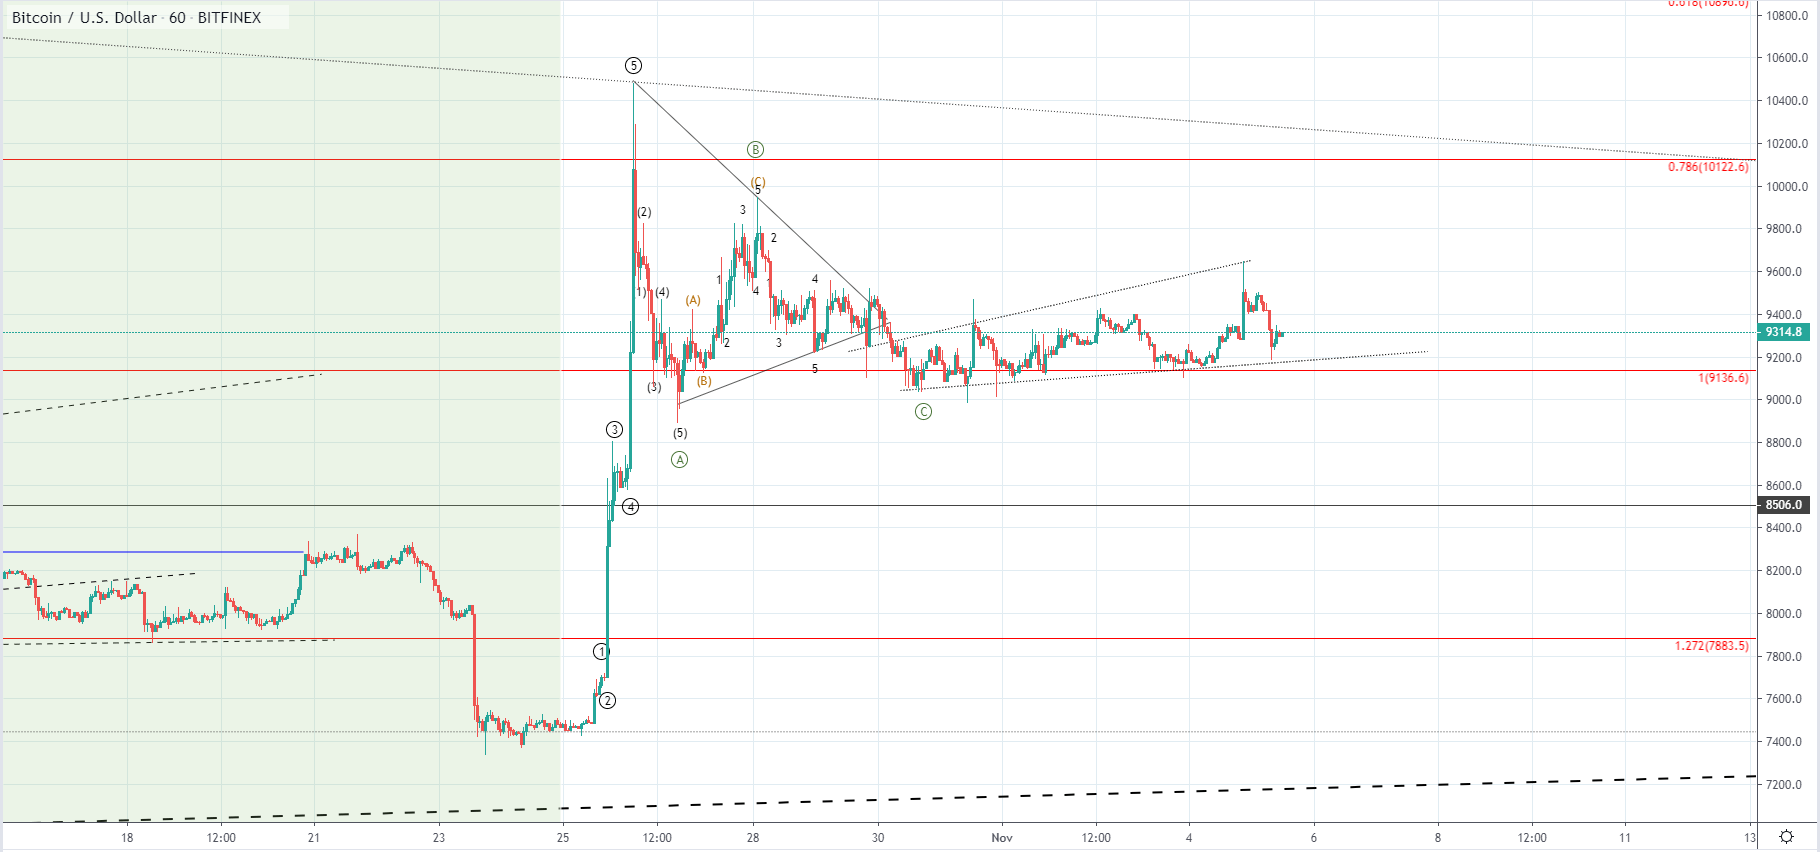
From yesterday’s low at $9160 the price of Bitcoin increased by 3.78% measured to the hourly candle close at its highest point today which is at around $9500. Since last Wednesday when the price came just below the 1 Fib level we have seen the formation of an ascending channel and the price retested its resistance level yesterday with a wick from the upper side of the hourly candle. As resistance has present the price started moving to the downside again and retested its support level finding support there which proved the channels’ relevance once more.
Another possibility would be that the ascending channel is the 2nd structure out of the three-wave move to the downside in which case a breakout below the 1 Fib level would be seen and is why the level serves as a pivot point.
XRP/USD
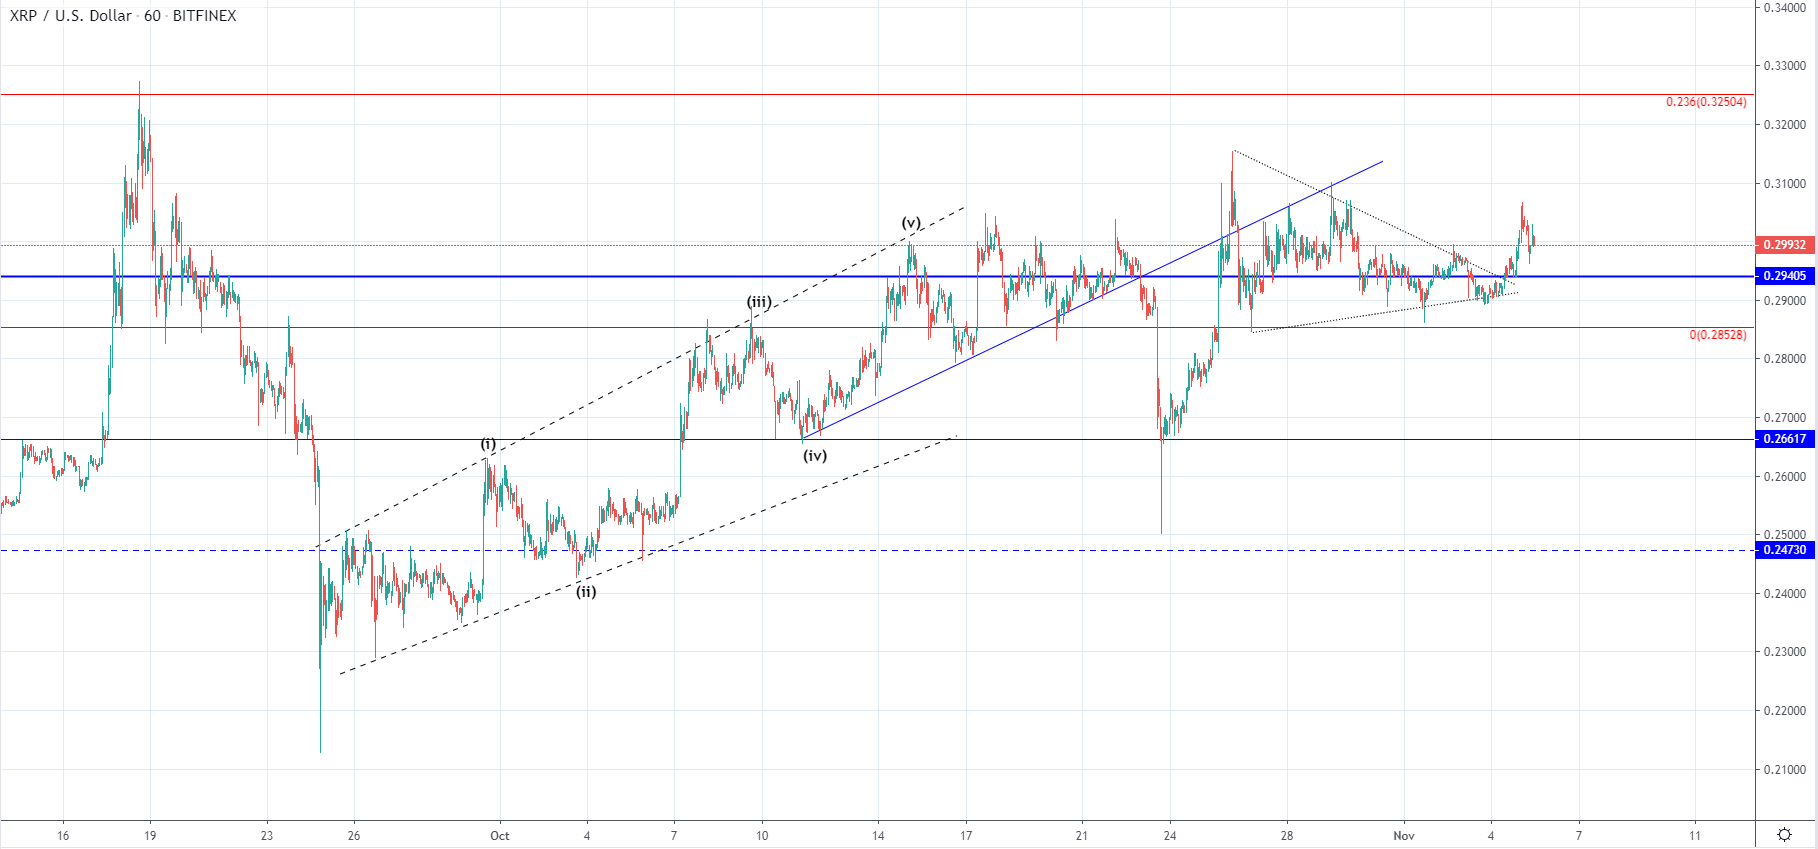
The price of Ripple has increased from yesterday’s low at $0.2903 by 5.55% as it came up to $0.3064 at its highest point today. Currently, the price is being traded slightly below the $0.3 mark but the price is in an upward trajectory overall.
On the hourly chart, you can see that the price made a breakout from the triangle which formed after the second attempt for the price to maintain above the significant horizontal level at $0.29405 failed. As the price has shown signs of bullishness after it managed to hold above 0 Fib level the seen increase could be the first sign that the price is to hold above the horizontal support but we could be seeing another corrective increase that is to retest the seller’s territory above.
Considering that the price hasn’t made a higher high compared to the one made on the 26th of October when the second attempt has been made we still cannot say that the price broke the mentioned horizontal level. If the price continues moving to the upside from here and makes an interaction with the next Fib level in line at around $0.325 it would be a good sign, but if the price doesn’t manage to exceed the $0.309 high before falling below the 0 Fib level again it would most likely indicate further downside for the price of Ripple in the upcoming period.