BTC/USD and XRP/USD recover, but for how long?
BTC/USD
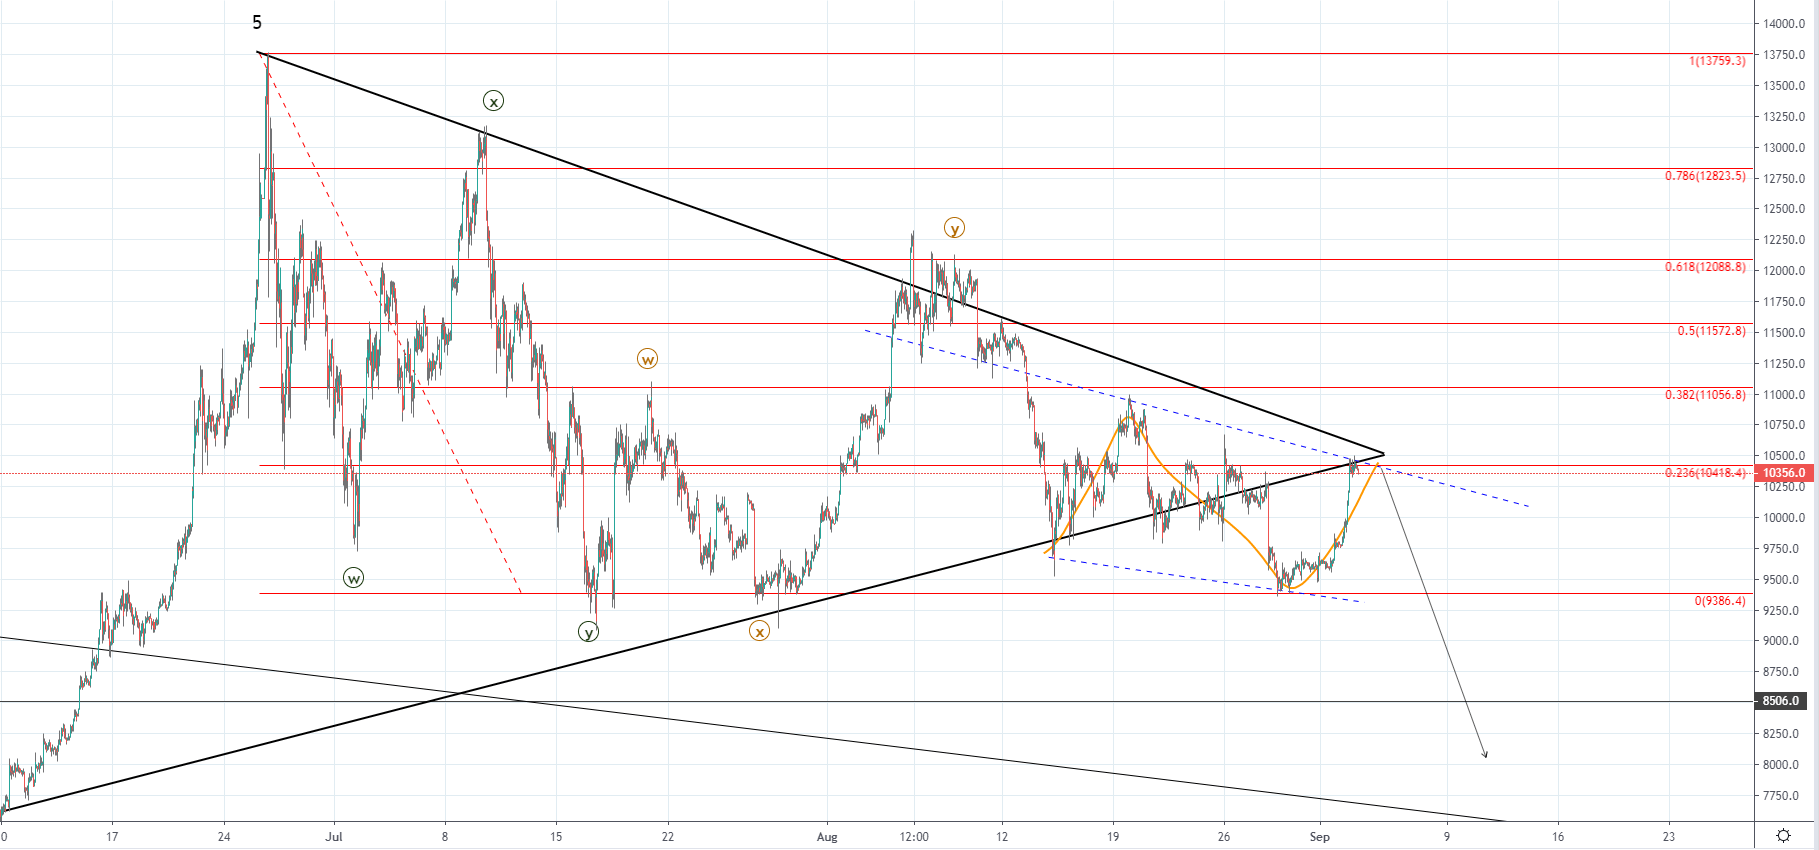
Last Monday the price of Bitcoin was $10503 and spiked further to $10675 at its highest point. From there the price has decreased by 10.41% as it came down to its lowest point at $9417.9 on Thursday. As the price came down to its significant horizontal support level last Thursday and found support there a recovery has been seen of around 11% as it came up to the same levels as on last Monday.
If the price gets rejected at the current levels it could be interpreted as a retest of the broken support which is set to cause another downfall with the price most likely going below the 0 Fib level which served as support potentially to around the $8500 area which serves as a the lower horizontal support level but if the breakout momentum increases it will likely not hold. As we’ve seen two WXY corrections the current structure is likely the third one which could either be a five-wave move or another three-wave correction but in either way from here I would be expecting further downside from here.
XRP/USD
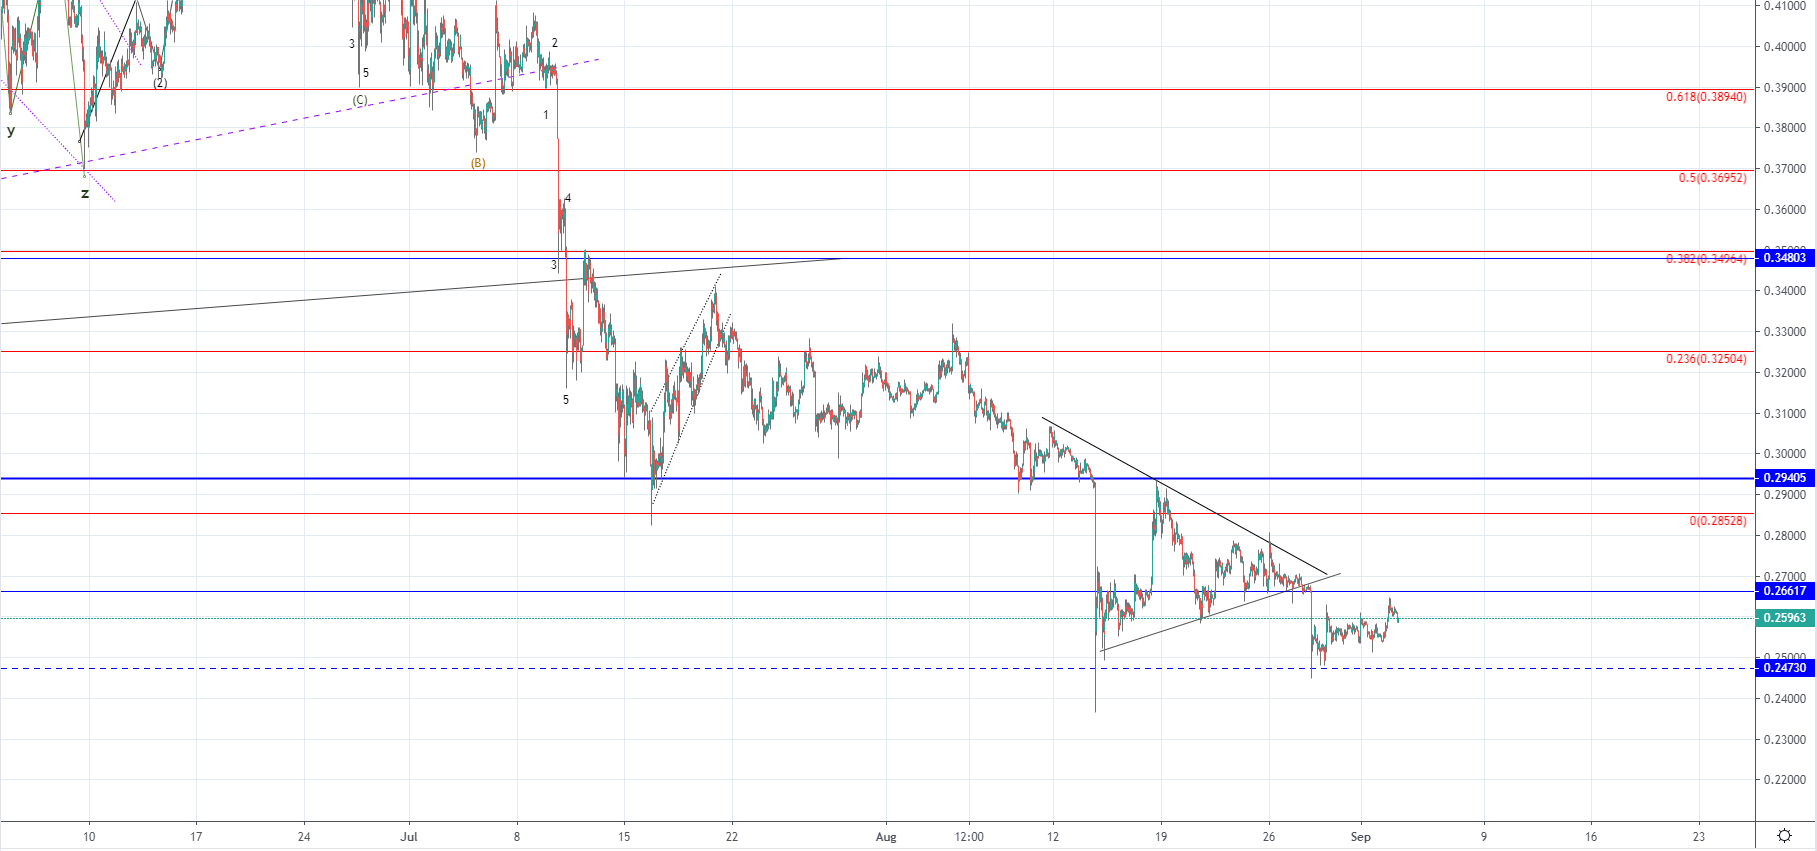
The price of Ripple was $0.27788 at its highest point on Monday from where we’ve seen a decrease of 10.34% at its lowest point to $0.249 made on Thursday but as the price came down to its lower horizontal support level and found support there a minor recovery has been seen of around 6% as the price came up to $0.2645.
If the price gets rejected at the upper horizontal level at $0.26617 we could see further downside for the price of Ripple but if the price manages to move above it and stays there we could see the recovery continuing to the most significant one at $0.29405.