BTC/USD and XRP/USD show strong bullish momentum
BTC/USD
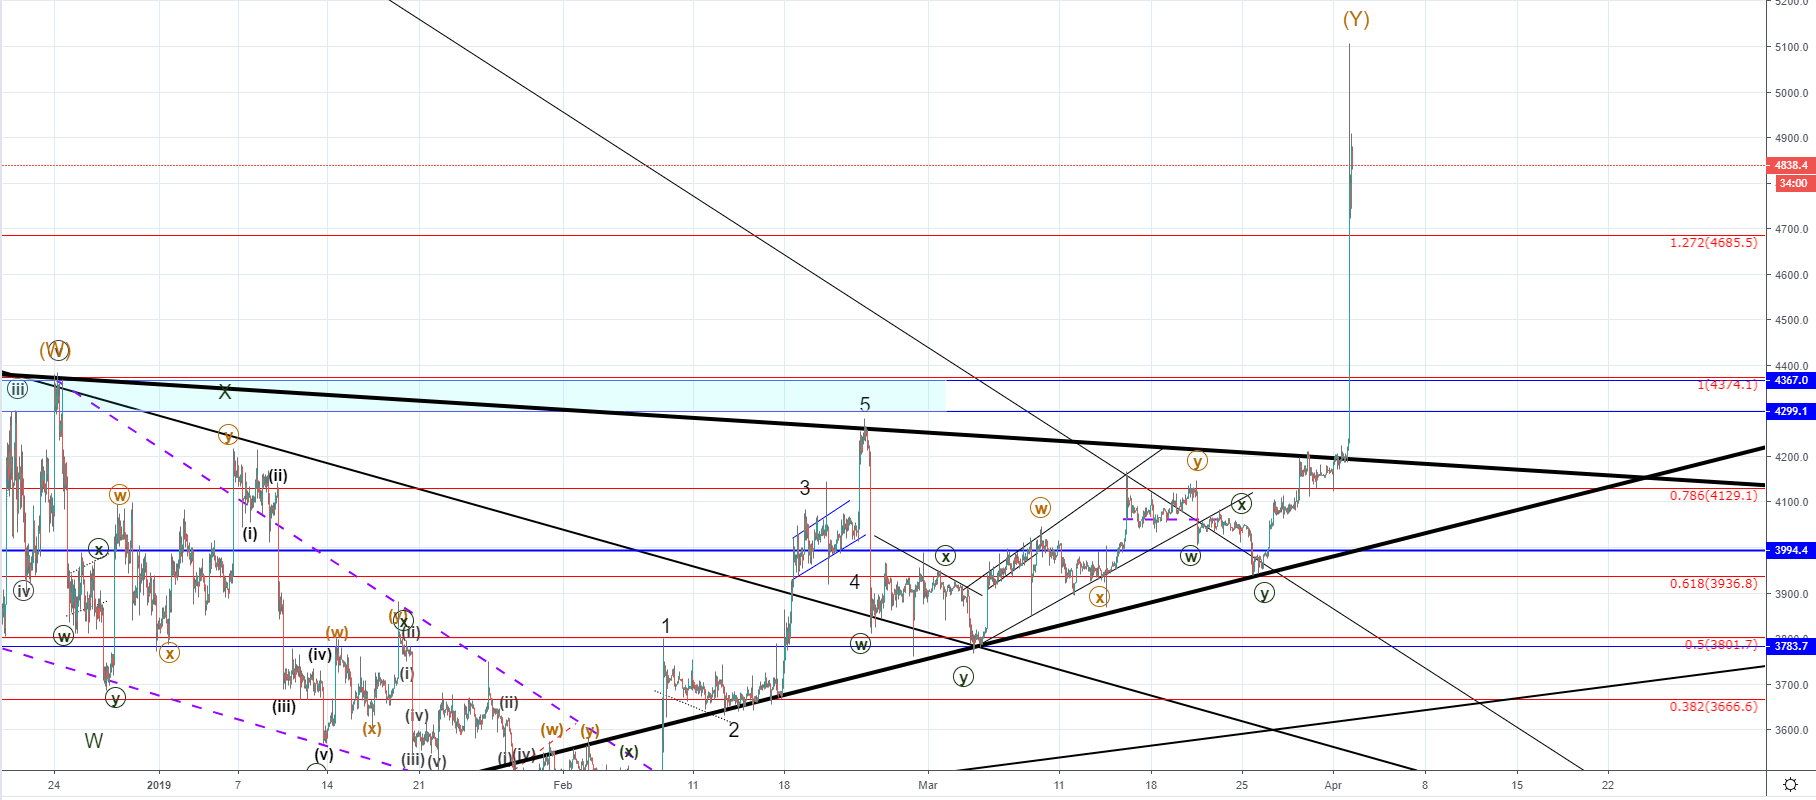
From yesterday when the price of BTC was at $4163 the BTC/USD pair has increased by 22.7% today measured to the highest point the price has been which is at $5108.
On the hourly chart, you can see that the price came to the descending trendline on Saturday when the interaction has been made. Then a minor retracement occurred to the 0.786 Fibonacci level where the price found support on a quick spike as it came back to the significant resistance level and was hovering around before finally going above it slightly, retested it from the upside. After that strong momentum was shown to the upside as the price increased impulsively and parabolically.
I was expecting that the interaction with the significant resistance level would end as a rejection with the price going down first to establish support on the lower ascending trendline around $3666 before we see a breakout to the upside. But instead, the price continued moving to the upside and has managed to break major key resistance levels along the way.
This bullish momentum could be the continuation of the Intermediate Y wave and as the price spiked to just little over $5100 and retraced by around 7% after we are now seeing the first signs of the momentum slowing down. From today’s highest point the price has retraced by 7.48% but has started increasing again and is currently 5.25% lower then on its highest point which could be an early indication that the momentum would continue.
As the price has increased exponentially we are now most likely to see consolidation above the 1.272 Fibonacci level which will now most likely get tested for support.
XRP/USD
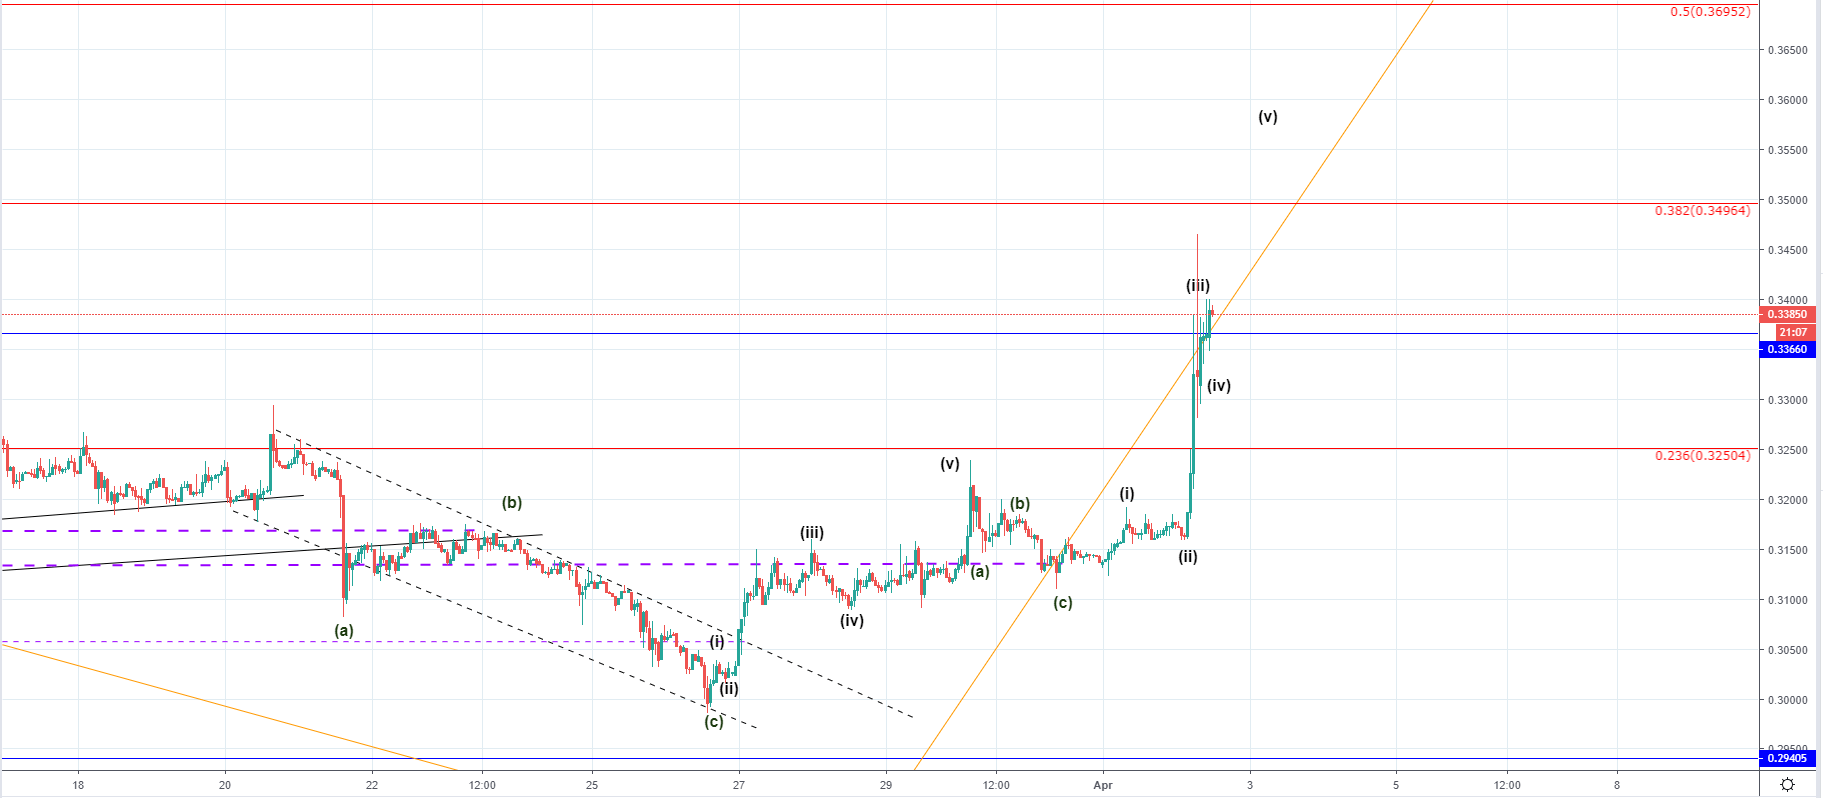
The price of Ripple has increased by 10.44% from yesterday’s open at $0.31367 measured to its highest point today at $0.34641.
The level is most likely going to serve as support but further retesting would be needed, and considering that we have most likely seen the development of the 3rd wave, now the 4th wave could develop above the level which would mean that now we could see some consolidation before another runup.