BTC/USD and XRP/USD showing signs of weakness but another increase is likely to happen
BTC/USD
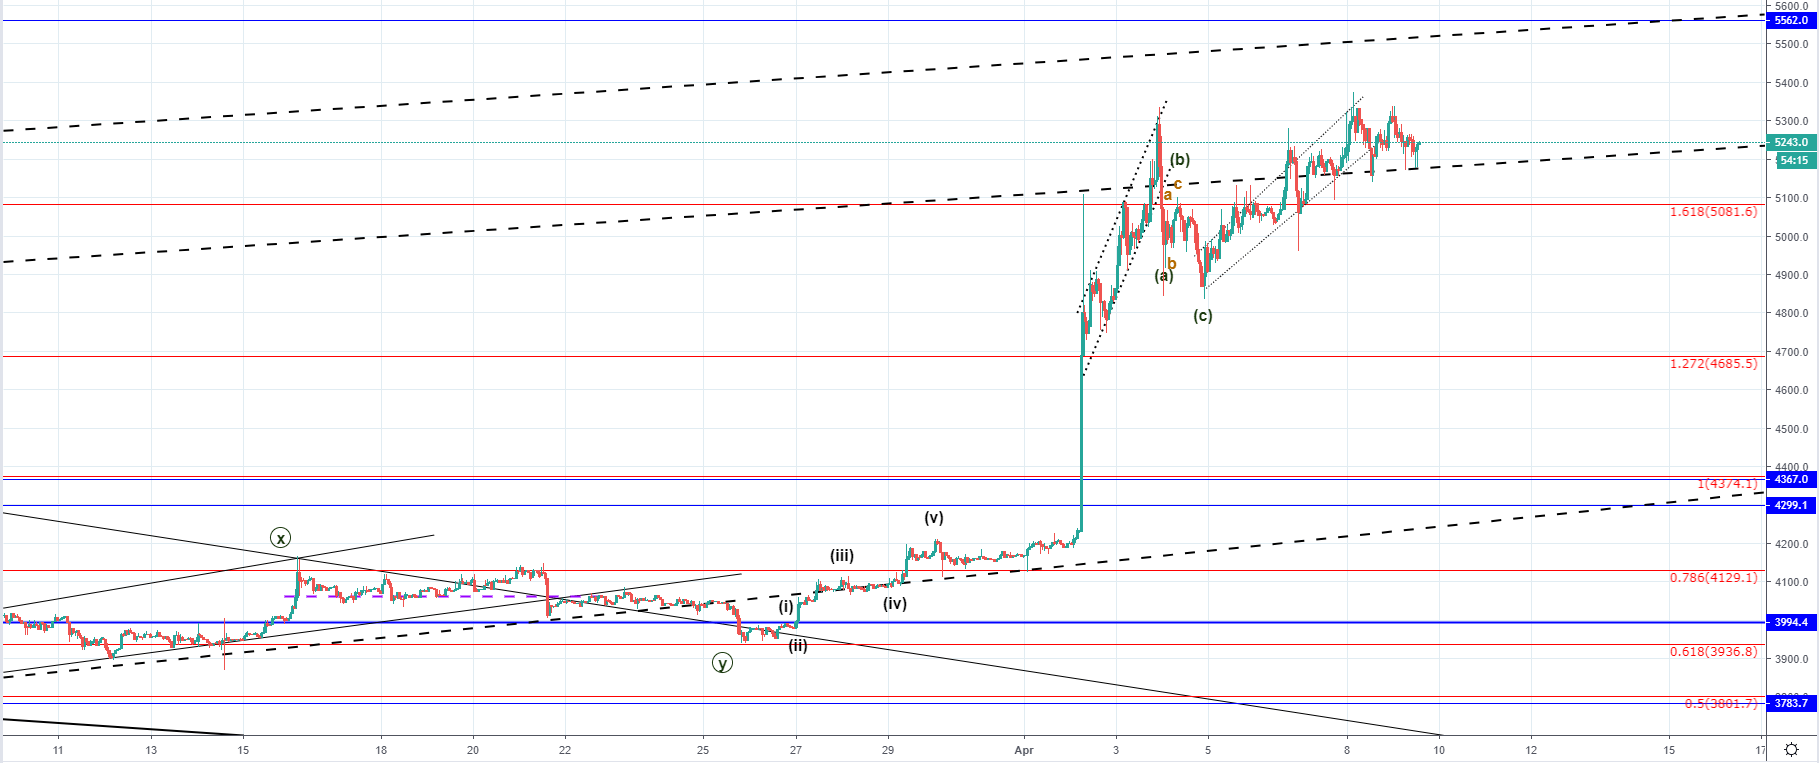
From last Tuesday when the price of Bitcoin was sitting around $4192 we have seen an exponential increase of the price of Bitcoin as on the same day it increased by around 17% in a matter of hours to $4894. The following the day the price continued its upward trajectory and has come up by another 8.15% before a significant pullback occurred on Friday when the price fell by approximately the same as the previous increase, as it came down from $5327 to $4861.9 which was a decrease of 8.73%.
Over the weekend the price continued increasing and came up to $5332 level again which has proven to be a significant resistance point as the price previously came to that level. It caused a sharp pullback, and has attempted another breakout yesterday but has been stopped out at those levels. Today the price again came close to the horizontal resistance level before starting to move to the downside again.
The price is still above the still unconfirmed ascending channel of a higher degree resistance level which serves as a minor support point as the price found support twice there after attempting to surpass the most recent high level but failed to do so. As we are seeing clear signs of struggle, the price is now most likely to attempt another run up which could exceed the prior high if there’s enough momentum in which case then I wouldn’t expect it to go past the $5562 horizontal level intersection with the upper ascending trendline which serves as resistance. The interaction with the area is expected but only as another attempt for the price to break out from the current structure which will most likely end as a rejection causing the price to start moving in a downtrend for a deeper retracement.
XRP/USD
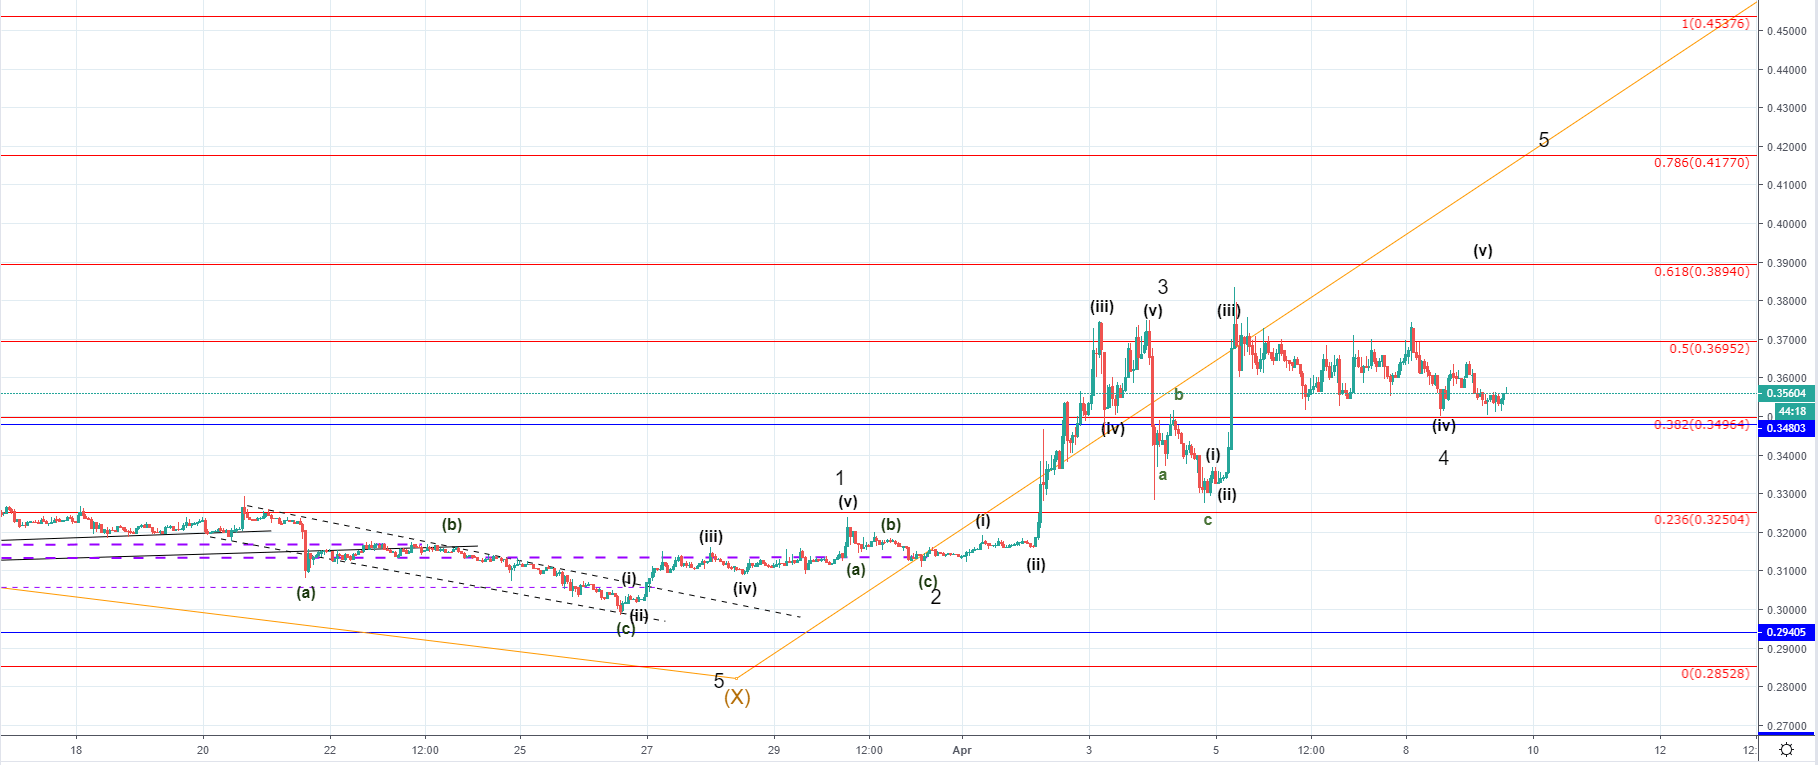
Last Tuesday, the price of Ripple was sitting around $0.31362. From there the price increased exponentially by around 19% like in the case of Bitcoin until the following day when it reached $0.374 area. From Wednesday until Friday we have seen a sharp pullback of 11.57% as the price came down to $0.33 area but another increase with strong momentum was seen, recovering the price back to the levels from which the downfall was made.
Over the weekend we have seen a corrective decrease of the price of Ripple which pushed the price down to around the 0.382 Fibonacci level which serves as a support. Now that the interaction has been made with the Fibonacci level the price has started moving to the upside again. From the current upside movement, we are to see the likelihood of another upswing but since the wave structure hasn’t developed fully I think we are to see another increase which would be the 5th impulse wave out of the five-wave move to the upside.
Before the 5th wave should start developing the current correctional structure has to end, and we could see the prolongation with another move to the downside potentially before it starts. The price is set to interact with some of the upper Fibonacci levels for the 5th wave completion so the most optimal level I would be looking for is at the 0.786 or in price terms at $0.4177.
Try bitcoin trading with FXOpen broker!