BTC/USD and XRP/USD showing sings of bullishness
BTC/USD
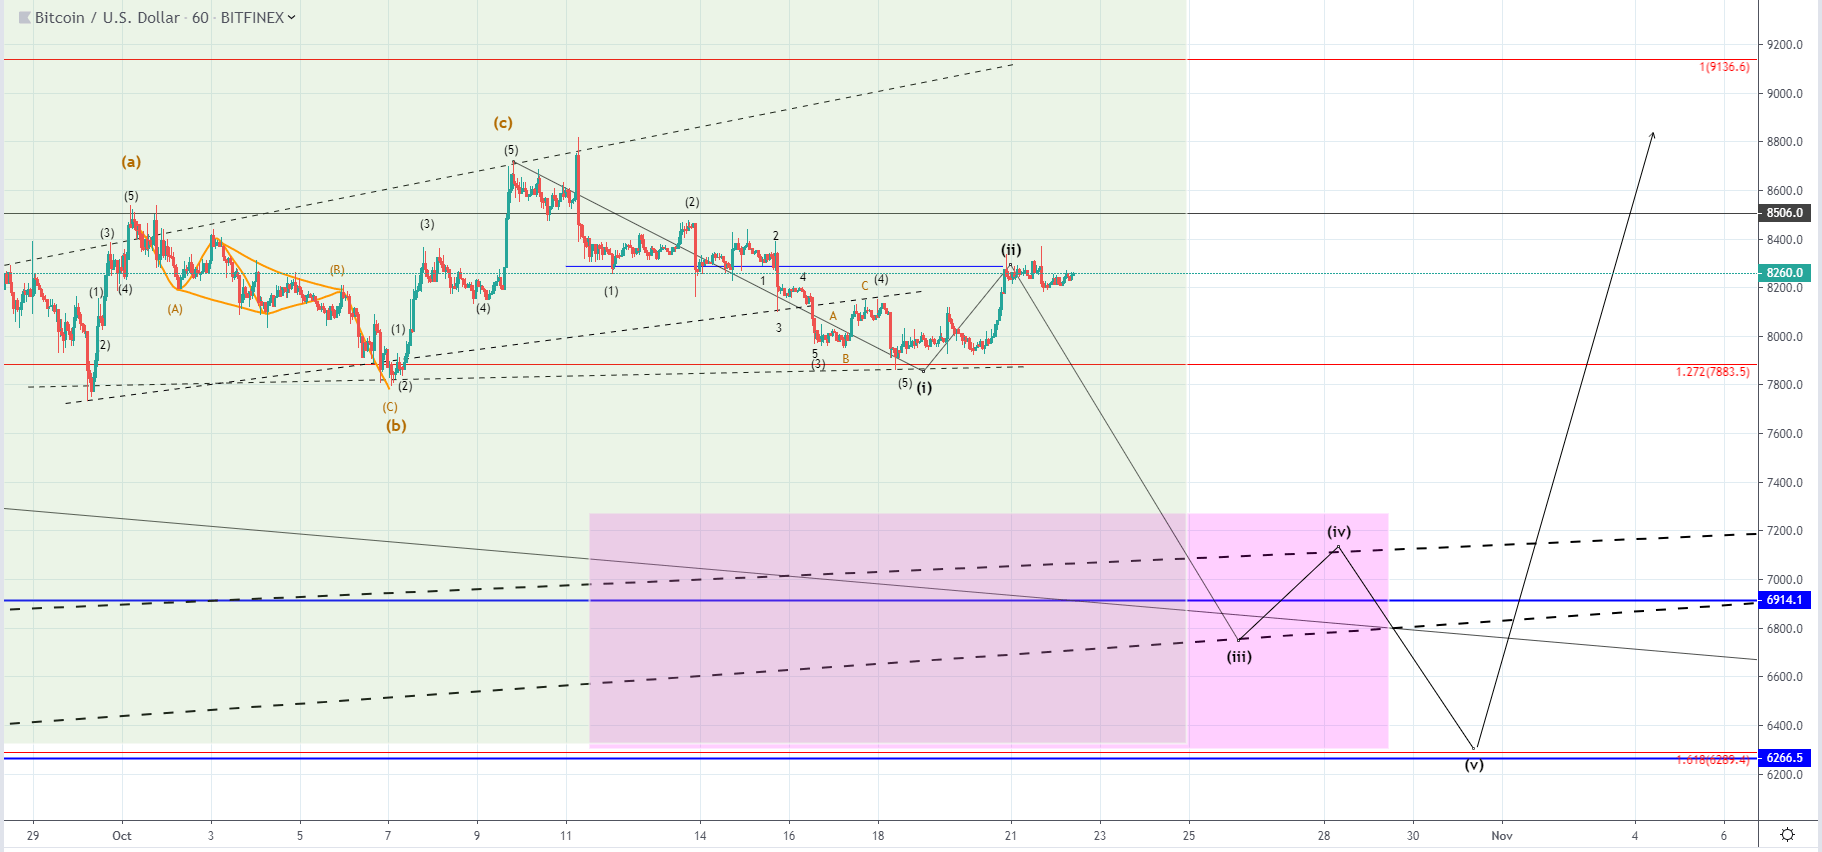
Last Friday, the price of Bitcoin has been sitting around $7913 at its lowest point as it was in a downtrend all throughout last week. But since the price retested the 1.272 Fibonacci level it started increasing again and managed to recover by 4.72%, coming to $8300 at its highest point today.
If the price gets immediately rejected at the current levels and with showing signs of struggle indicated the candlestick on a couple of previous candles on the hourly chart, we are going to see a breakout to the downside below the 1.272 Fibonacci level and potentially on to the next one at 1.618.
XRP/USD
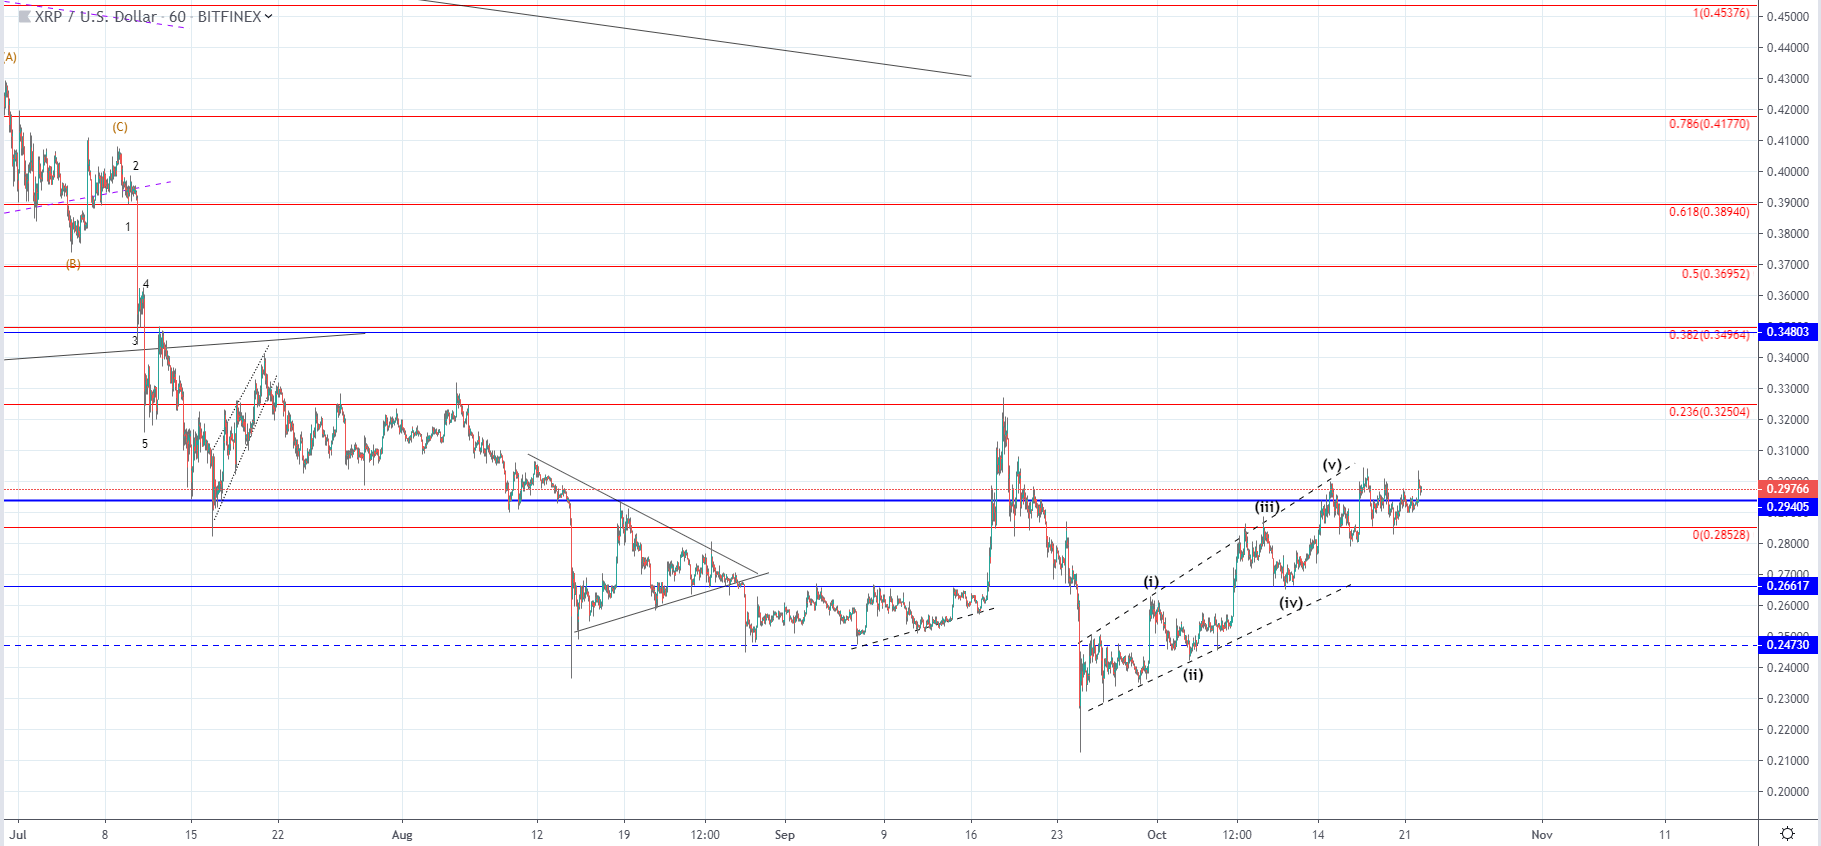
From last week when the price of Ripple came up to around the significant horizontal level at $0.29405, we have seen the price moving sideways. Currently, it is above the level and in an upward trajectory, but we can’t say that a breakout has been seen as it failed to exceed the prior high, made on the first attempt.
Looking at the price action it looks like the buyers are putting pressure on the current significant horizontal resistance so the move to the downside to $0.247 might not happen in which case it would be very difficult to say if it was the 2nd wave or not. In either way, I would be expecting a retracement from here after which a breakout to the upside should develop.