BTC/USD and XRP/USD stuck in a range but more downside expected
BTC/USD
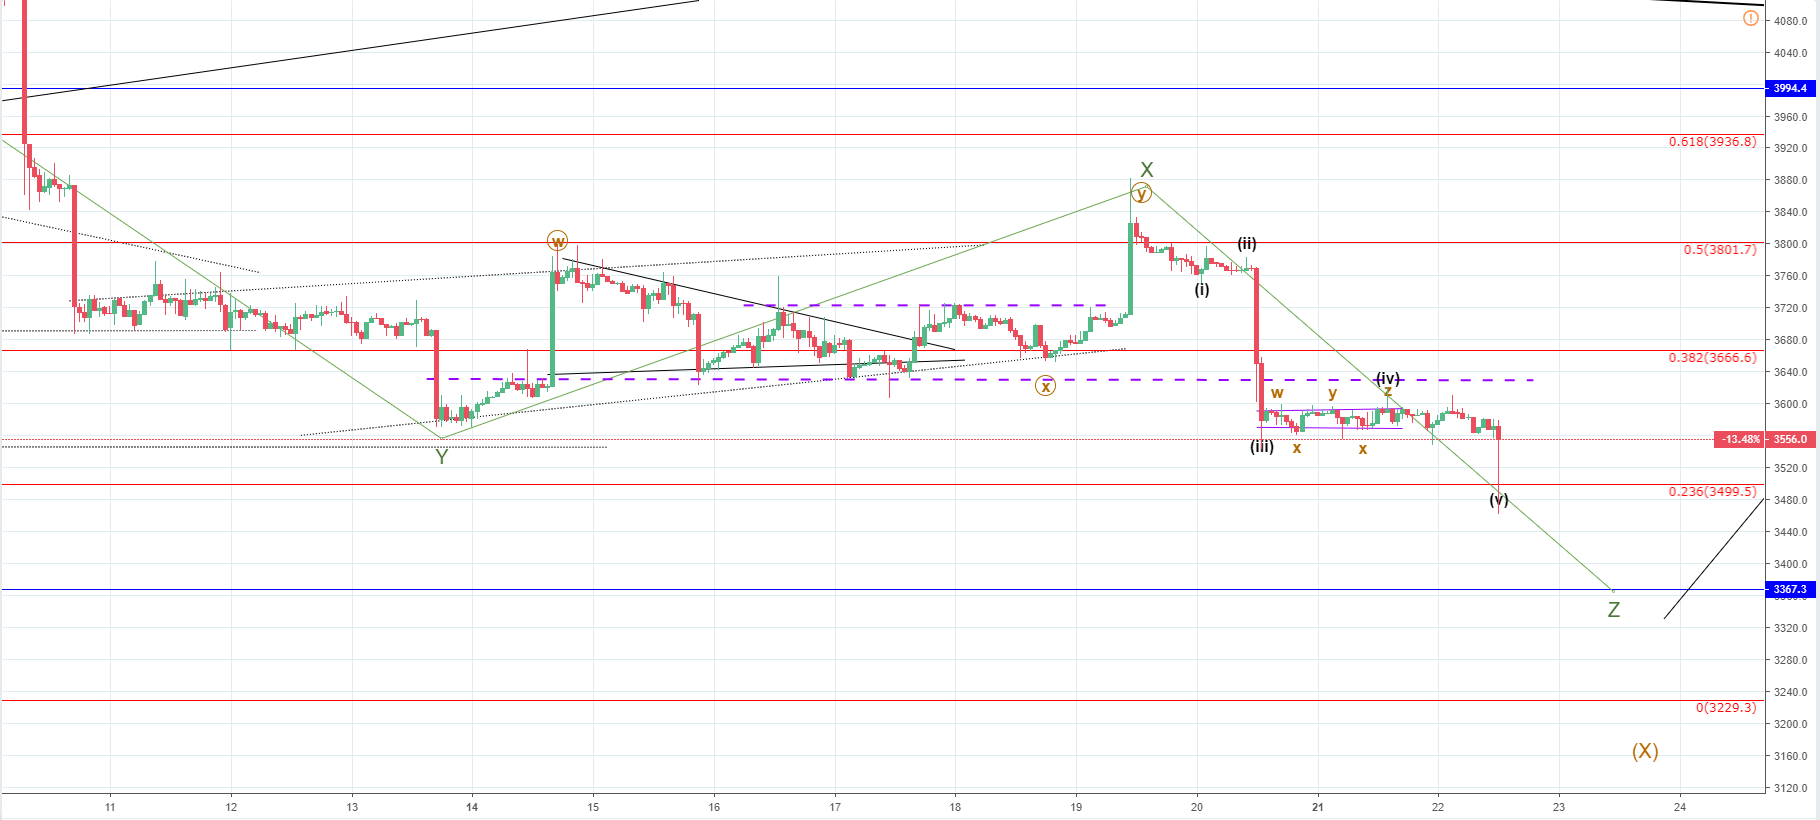
From last week’s analysis on Tuesday 15th when the price of Bitcoin was $3761 measured to the current level of $3560, we have seen a decline of 5.32%.
Looking at the hourly chart, you can see that the price of Bitcoin was steadily decreasing from last Tuesday’s price at first. But then later during the day it dropped by 2% in just one hour coming down from $3713 to $3640, where the ending point of the first wave of the previous impulsive move to the upside or Minute W wave, where some support was established. During the rest of the last week, the price has gone sideways and stuck in a range between $3640 and $3723 (interrupted purple lines).
Finally, on Saturday a breakout from the upside occurred and the price of Bitcoin went from the 0.382 Fibonacci level to 0.5, from $3666 to $3801 in the price terms. But since it was the wave Y from the Minute WXY correction, after all, more downside happened. The price started pulling back steadily at first when the resistance at the 0.5 Fibonacci level was encountered. But when it came down to $3769 it started dropping fast and came down to $3546 in a matter of a few hours, but was supported by the buyers, who immediately pushed the price up to $3578 where the hourly candle closed.
From then, the price has stuck in a minor range between $3564 and $3591 until today, when it attempted a breakout from the downside and spiked down below the 0.236 Fibonacci level. But the price came up back leaving only a wick on the hourly chart.
As the interaction with the expected level for the 5th wave occurred, we are likely going to see a further downfall to that level for a proper establishment of support. Previous sideways movement from 14th of January until 19th was the second wave X from the Minor WXYXZ correction, so the current downward movement is the final wave Z. This might not happen in a straight line as a breakout to the upside might occur as the buyers shown strength previously pushing the price up fast. This might activate buying and chasing of the price.
The target price for the expected ending point of the wave Z would be at around $3367 on the next horizontal level significant enough after the 0.236 Fibonacci level.
XRP/USD
From last Tuesday, when the price of Ripple was $0.34156 measured to the current level of $0.32136, we have seen a decrease of 5.87%.
Looking at the hourly chart, you can see a similar chart pattern like in the case of Bitcoin – last week a Minute WXY correction to the upside ended, which was the second wave X from a Minor WXYXZ correction. The price of Ripple decreased from there and fell from $0.3396 to $0.3158 at the lowest point of the week, but the buyers pushed the price up above the horizontal level at $0.32032, which was the prior low level where the price has been hovering since.
The price is currently in an upward trajectory but has reached some minor resistance at the descending trend line from the current range. Looking at the wave structure I believe that we will see a breakout to the upside as this is most likely a triple three correction. But I don’t believe that the price will go higher than the previous support zones’ lower level at $0.327. After this ends I would be expecting further downside as the Z wave fully develops and the price target for the expected decrease would be at around $0.3 area.