BTC/USD continues increasing while XRP/USD showing signs of weakness.
BTC/USD
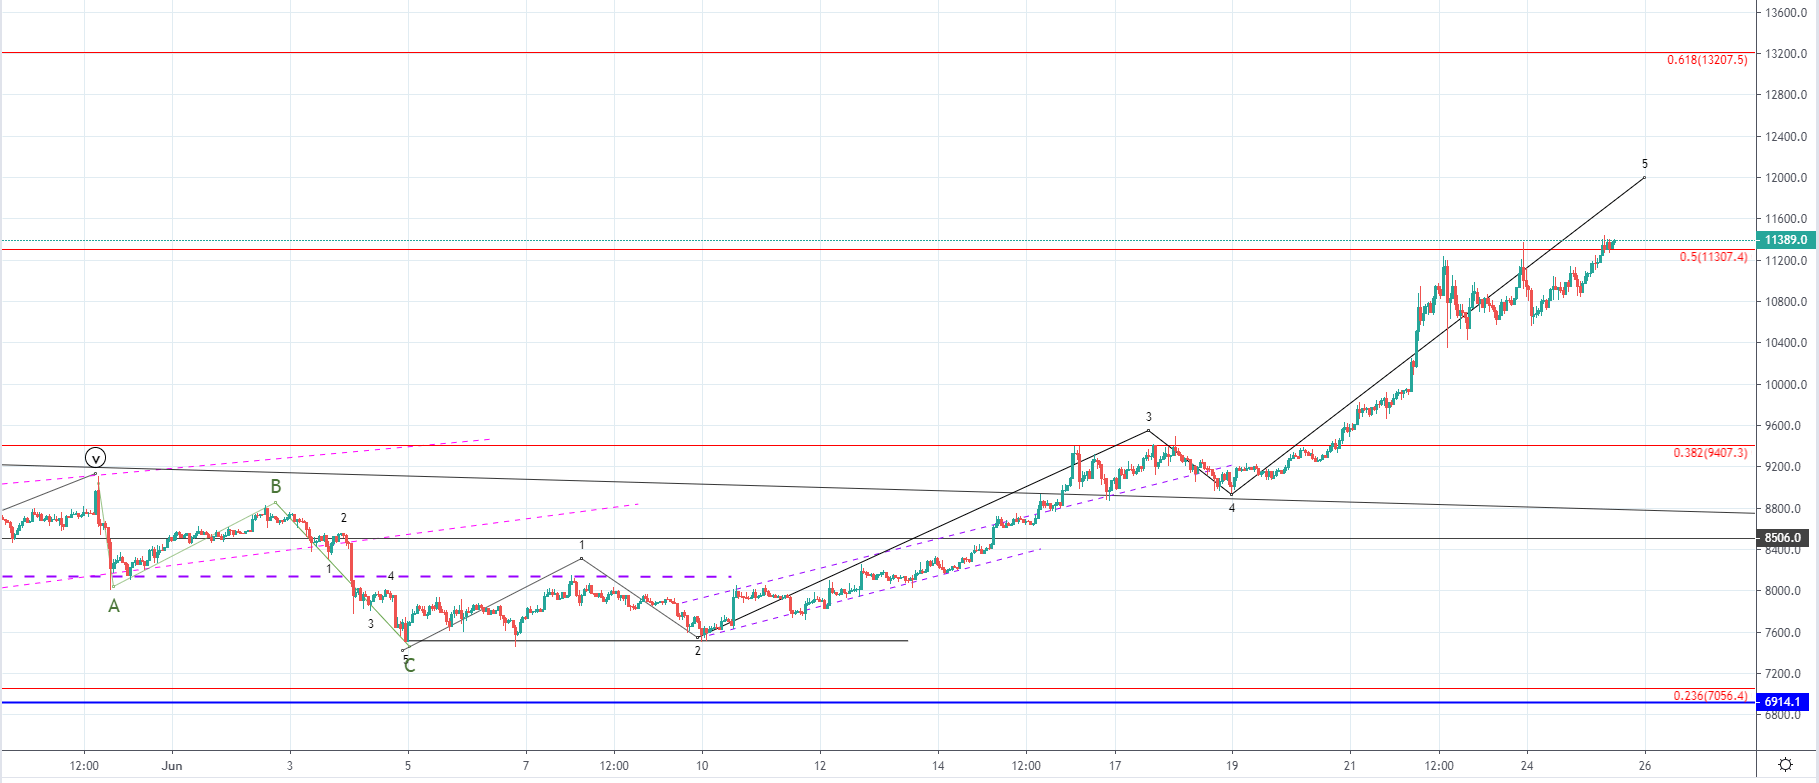
From last weeks Monday when the price of Bitcoin was sitting at $8986 at its lowest, we have seen an increase of 26.55% measured to the highest point the price has been today which is at $11372. The price continued increasing after yesterday’s pullback of around 4.87% which brought the price down to $10633 and is still in an upward trajectory.
On the hourly chart, you can see that the price of Bitcoin came up to the 0.5 Fibonacci level and has been stopped out at the resistance found on those levels yesterday which is why we’ve seen the formation of the horizontal sideways range. But the pullback was only a minor one as the price continued increasing steadily after the retracement and is currently attempting to break out to the upside above the significant resistance point.
The price is currently above the 0.5 Fibonacci level and is retesting it for support. If the price finds support at the current levels further upside movement could be seen to the next significant Fib level of 0.618 which is in price terms at $13207. The wave structure implies that we are seeing the 5th wave of the five-wave impulse which started on 5th. This means that after some further upside correction is soon to be expected.
If the five-wave impulse from 5th is the ending wave of the impulse from the higher degree its completion would mark the end of the bullish rise we’ve seen from 15th of December. The price doesn’t find support around the current levels and starts falling down fast it would indicate that the buyer’s interest has gotten weaker than the seller’s pressure and would, in that case, indicate the end of the last five-wave impulse.
The bullish momentum doesn’t seem to be showing any signs of weakness which is why more likely we are to see further upside move before the downturn starts.
XRP/USD
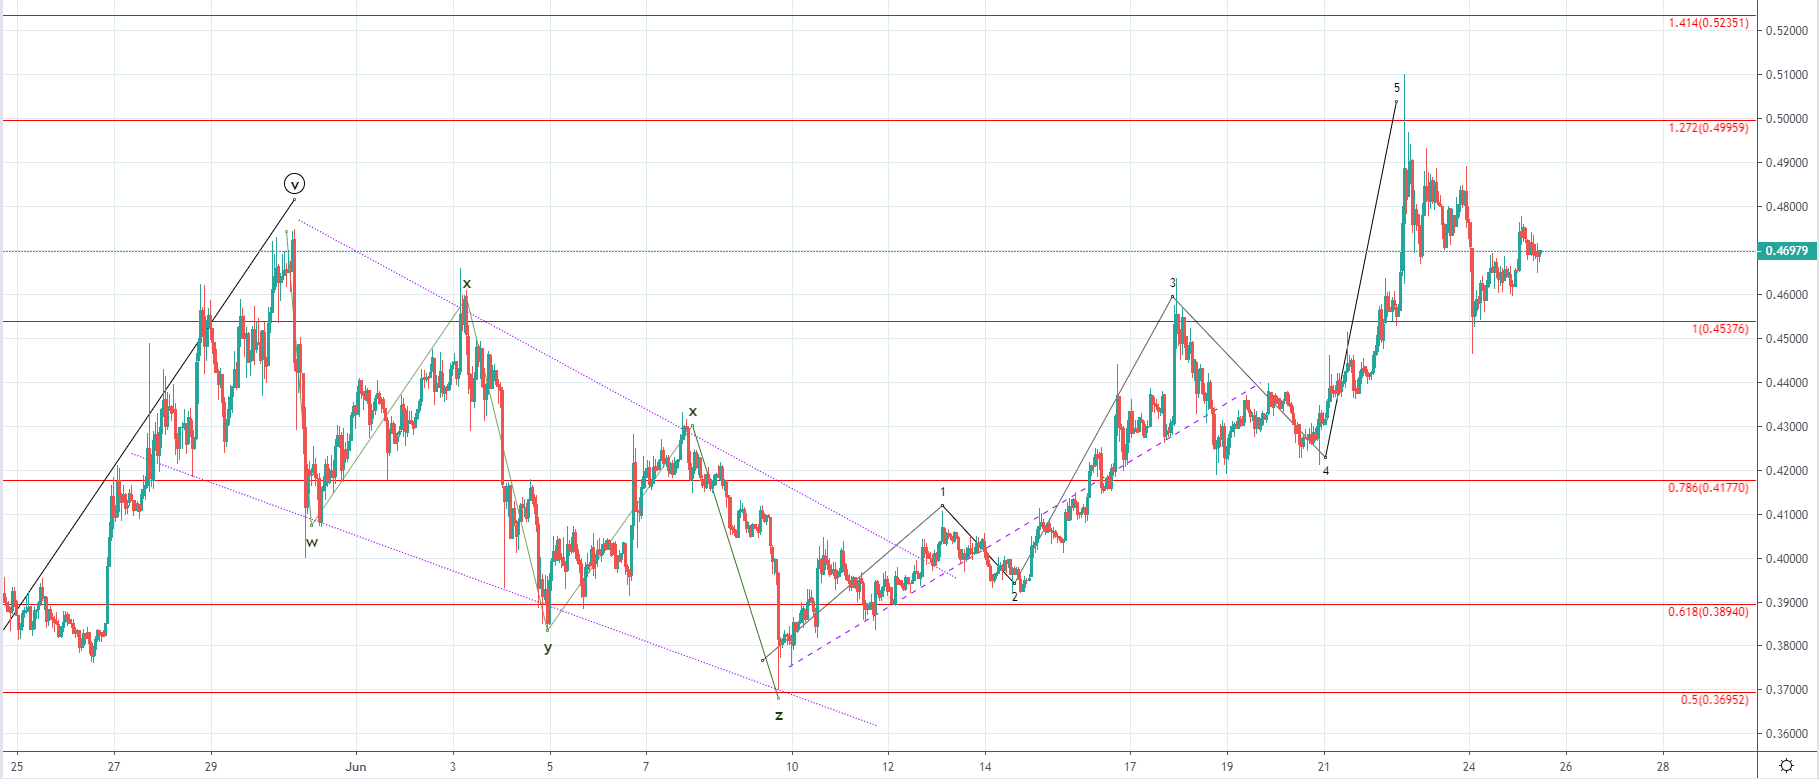
Over the weekend the price of Ripple has increased by 15.6% coming from Friday’s low at $0.4233 to $0.4895 on the next day and spiked even higher, above $0.5. Since then the price has started decreasing and has come down by 7.3% on Monday as it came down to $0.454. From yesterday’s low, the price started increasing again and $0.4751 at its highest point today around which it is currently being traded.
The wave structure implies that we have seen the completion of the five-wave impulse from Monday 10th of June which is why we are now most likely seeing a correction taking place. If this is true then the price has started developing the second wave out of the correctional move with the third one to the downside shortly to develop. This third wave would bring the price of Ripple below the 1 Fibonacci level which now serves as support.
Previous to the formation of the last five-wave move to the upside we’ve seen a descending channel inside which a five-wave correction to the downside developed. This WXYXZ correction has developed after the 5th wave of the Minute degree ended and now we could either be seeing the uptrend continuation in a form of another impulse wave or the second wave out of the higher degree three-wave correction.
Since the five-wave impulse from 10th looks like it ended now we are likely to see downside movement which could be only a minor one before further uptrend continuation or the start of the expected downturn alltogether.