BTC/USD and XRP/USD started recovering
BTC/USD
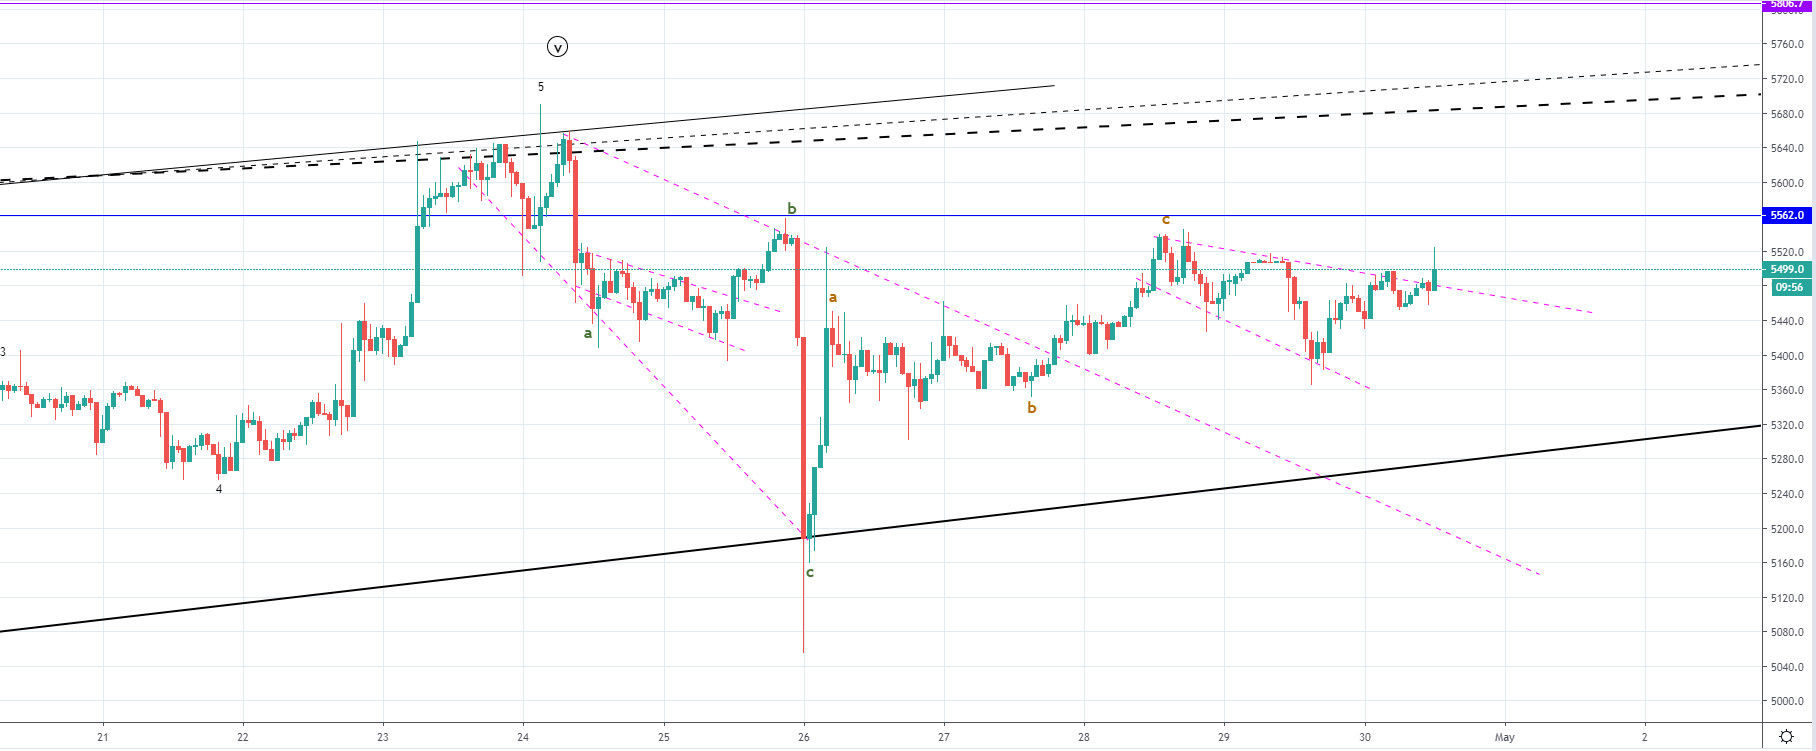
From last Monday when the price of Bitcoin was $5266.5 we have seen an increase of 7.27% until Wednesday when the price came up to $5649. Since Wednesday the price of Bitcoin experienced a downfall below Monday’s open as the price came down to by 8.23% at its lowest point on Friday when it was sitting at $5185 at the open and even spiked lower to $5056. Over the weekend we have seen another increase as the price started recovering. But the increase ended on Sunday when the price reached the horizontal resistance at around $5562 from where another minor downtrend has started.
On the hourly chart, you can see that the price action formed an expanding triangle from Sunday until today as the attempt for a breakout to the upside is currently being made. The price looks like it found some strong resistance as indicated by the wick from the upside seen on the last hourly candle so we are yet to see if the attempt ends as a fakeout.
As Wednesday’s high was most likely the 5th wave out of the five-wave impulse to the upside we could be seeing the correction of a higher degree starting to develop. In this case the two outlines structures would be its two sub-wave and that is why they have been labeled as two ABC corrections. The weekend’s increase has developed in a three-wave manner and as the price fell below the $5416 level and entered the territory of the B wave. It confirmed that we aren’t seeing a five-wave move to the upside developing but that the increase indeed ended as a three-wave correction.
The price is still inside the territory of the ascending channel with whose support level the price interacted on Friday’s low, so we could still be seeing the development of the same correctional structure that started on 3rd of April. This would mean that the 5th wave hasn’t ended but since I’ve counted five sub-waves I think that it has. So now I would be expecting a breakout to the downside which would be the 4th wave of the higher degree with another and the final increase expected after.
XRP/USD
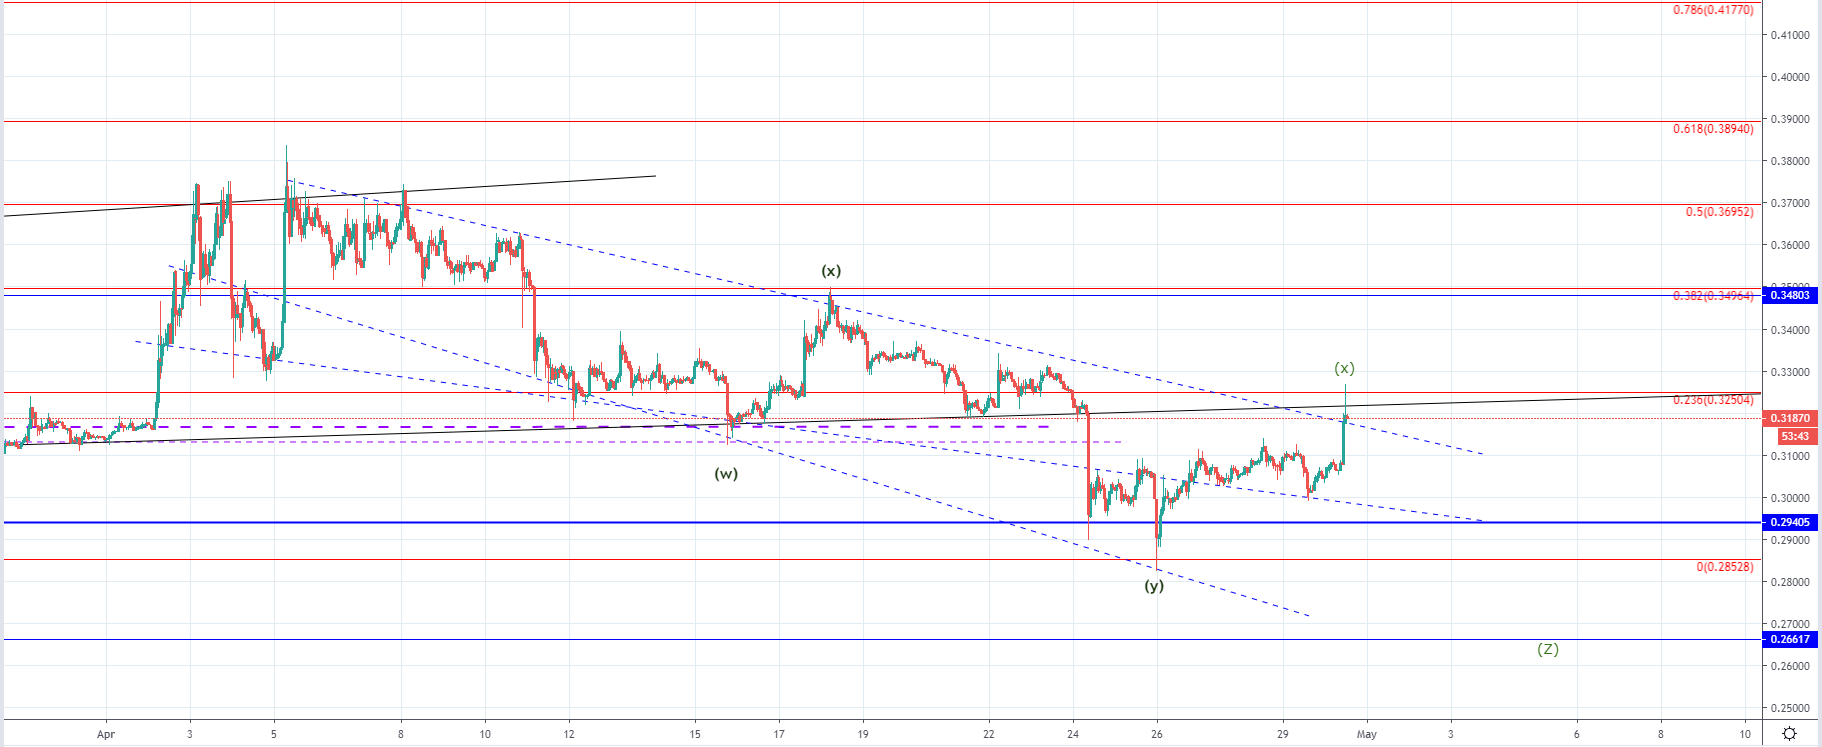
From last week when the price of Ripple was sitting around $0.33 at its highest, we have seen a decrease of 12.37% until Friday’s low at $0.28952. Over the weekend the price has started recovering and came up to $0.31209 but from there again fell to the $0.3 level yesterday.
From yesterday’s low at around $0.3 the price of Ripple has started increasing again and came up by 6.12% today, reaching $0.32 and spiking even further up. On the hourly chart, you can see that the price attempted to breakout from the territory of the descending channel in which it was since 3rd of April but clearly found strong resistance around the 0.236 Fibonacci level which intersects some of the significant support levels that were broken with strong momentum and are now serving as strong resistance points.
The correction from 3rd of April might have ended as I’ve counted the sub-waves and believe that the Y wave ended. But since the increase from Friday looks three-wave-ish we could be seeing the prolongation of the mentioned correction in which case the weekend’s recovery would be the second wave X. This means that another move to the downside for a lower low could occur, but that will soon be validated by the price action movement as if the price continues moving to the upside and finds support around the current levels we have likely seen the end of the correction.
If the price, however, starts immediately dropping and enters the territory of the descending channel we are likely to see another lower low before the correction is over, and the most likely target would be below the 0 Fibonacci level which is the starting point of the correction of a higher degree that started on 15th of December.