


BTCUSD and XRPUSD Technical Analysis – 21st MAR 2023
FXOpen
BTCUSD: Morning Star Pattern Above $23935
Bitcoin continues its bullish momentum from last week and after touching a low of $23935 on 15th March, the price started to correct upwards against the US dollar, touching a high of $28439 on 20th Mar.
We have seen a bullish opening of the markets this week.
We can clearly see a morning star pattern above the $23935 handle which is a bullish reversal pattern because it signifies the end of a downtrend and a shift towards an uptrend.
Bitcoin touched an intraday high of 28180 in the Asian trading session, and an intraday low of 27378 in the European trading session today.
The price of bitcoin is ranging near a new record high of 1 year.
Both the STOCH and Williams percent range are indicating overbought levels which means that in the immediate short term, a decline in the prices is expected.
The RSI indicator is back over 50 in the 2-hourly time frame indicating bullish trends.
The relative strength index is at 63.77 indicating a strong demand for bitcoin, and the continuation of the buying pressure in the markets.
Bitcoin is now moving above its 100 hourly simple moving average and above its 100 hourly exponential moving averages.
Most of the major technical indicators are giving a BUY signal, which means that in the immediate short term, we are expecting targets of 28000 and 28500.
The average true range is indicating less market volatility with a bullish momentum.
- Bitcoin: bullish continuation seen above $23935.
- The STOCHRSI is indicating an oversold market.
- The price is now trading above its pivot level of $27744
- The short-term range is strongly bullish.
Bitcoin: Bullish Continuation Seen Above $23935

The price of Bitcoin is now moving in a strongly bullish momentum above the $27000 handle. After some retraction we can see fresh upsides in the ranges of $28000 to $28500.
We can see the formation of a bullish price crossover pattern with the adaptive moving average AMA 100 in the 2-hourly time frame.
The price of bitcoin is ranging near the support of the triangle in the 1-hour time frame indicating a bullish scenario.
We have also detected the formation of a three white soldiers pattern in the 30-minute time frame indicating a bullish outlook.
The immediate short-term outlook for bitcoin is strongly bullish, the medium-term outlook has turned bullish, and the long-term outlook remains neutral under present market conditions.
Bitcoin’s support zone is located at $24152 at which the price crosses the 9-day moving average, and at $25825 which is a 14-3 day raw stochastic at 70%.
The price of BTCUSD is now facing its classic resistance level of 27861 and Fibonacci resistance level of 28072 after which the path towards 28500 will get cleared.
In the last 24hrs, BTCUSD has decreased by 0.88% by 246.91$ and has a 24hr trading volume of USD 38.608 billion. We can see a decrease of 18.76% in the trading volume compared to yesterday, which appears to be normal.
The Week Ahead
We can see that bitcoin continues its bullish momentum and the prices continue to remain above the $27000 handle. We are now looking for fresh upsides in the range of $28000 and $29000.
The demand for bitcoin continues and we can say that now crypto winter has ended with the resumption of the long-term bullish trend in the BTCUSD.
The daily RSI is printing at 70.68 which indicates a strong demand for bitcoin and the continuation of the bullish phase present in the markets in the short-term range.
We can see the formation of a bullish trend line from $23935 towards the $28667 Levels.
The price of BTCUSD is now facing its resistance zone located at $28496 which is a 1-month high and at $28796 which is a pivot point 1st resistance point.
The weekly outlook is projected at $29000 with a consolidation zone of $28500.
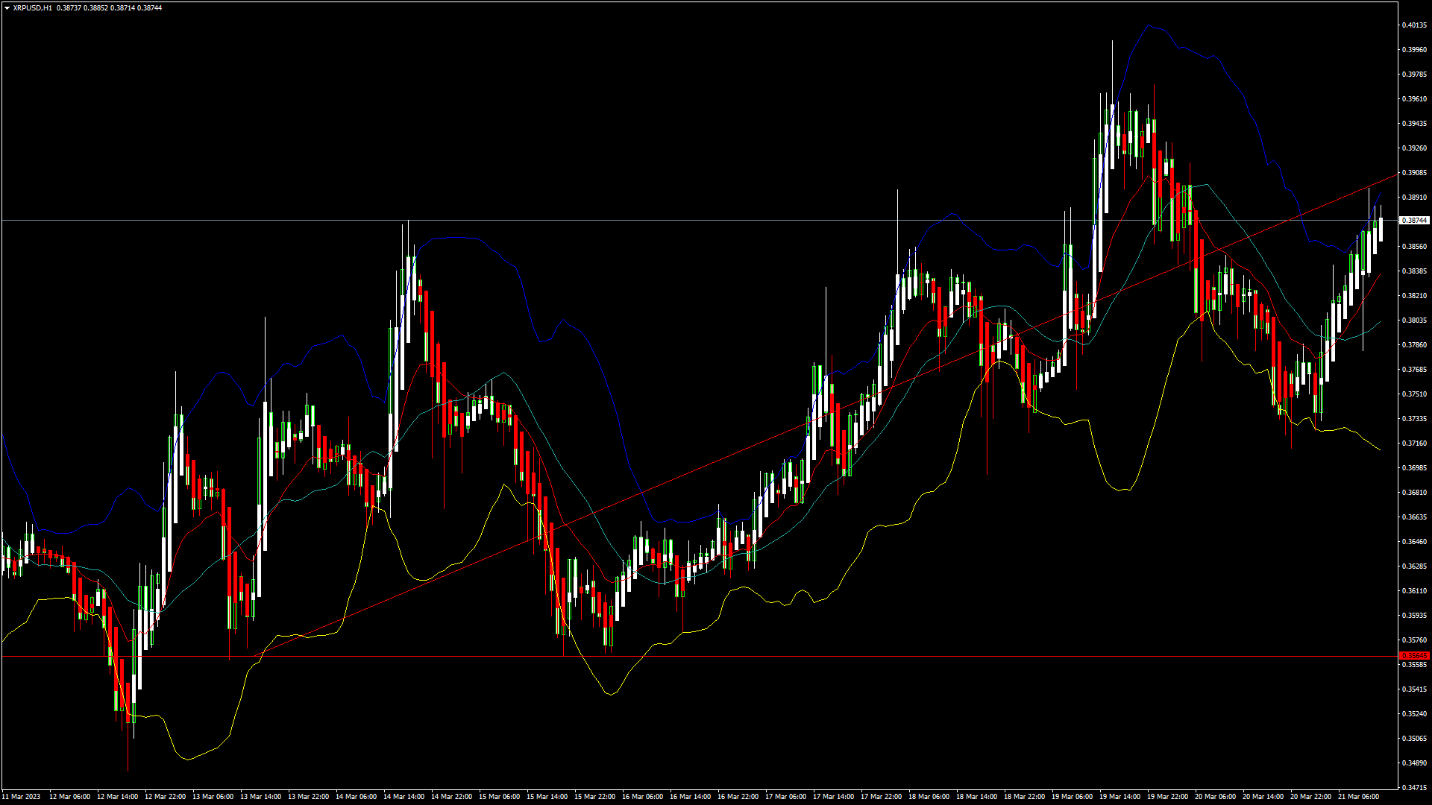
XRPUSD: Double Bottom Pattern Above $0.3564
Ripple was unable to sustain its bearish momentum last week and after touching a low of $0.3564 on 15th Mar, the prices started to correct upwards against the US dollar touching a high of $0.3989 on 19th March.
We have seen a bearish opening of the markets this week.
We can clearly see a double bottom pattern above the $0.3564 handle which is a bullish reversal pattern because it signifies the end of a downtrend and a shift towards an uptrend.
Ripple touched an intraday low of 0.3726 in the Asian trading session and an intraday high of 0.3891 in the European trading session today.
The prices of ripple are ranging near a new record high of 1 month.
The relative strength index is at 60.50 which signifies a strong demand for Ripple at the current market price and the continuation of the bullish phase in the markets.
Most of the moving averages are giving a buy signal at the current market levels of 0.3880.
Both the STOCHRSI and Williams percent range are indicating an overbought level, which means that the prices are expected to decline in the short-term phase.
Ripple is now trading just above its pivot level of 0.3859 and facing its classic resistance level of 0.3888 and Fibonacci resistance level of 0.3921 after which the path towards 0.4000 will get cleared.
Most of the major technical indicators are giving a buy signal.
- Ripple: bullish reversal seen above the 0.3564 level.
- The price is above its pivot level.
- The average true range indicates high volatility.
- Ripple gains bullish bias against the US dollar.
Ripple: Bullish Reversal Seen Above $0.3564
We can see a continuous correction in the prices of Ripple after every decline which indicates that we are in the start of a very strong bullish momentum. The next visible targets for XRPUSD are 0.4000 and 0.4400.
We can see the formation of bullish engulfing lines in the daily time frame.
The momentum indicator is back over zero in the daily time frame indicating a bullish trend.
We can see the formation of a bullish price crossover pattern with the adaptive moving average AMA50 in the daily time frame.
The RSI indicator is back under 50 in the daily time frame indicating bullish trends.
The resistance of the triangle is broken in the daily time frame indicating a bullish scenario.
The short-term outlook for Ripple has turned bullish, the medium-term outlook is bullish, and the long-term outlook is neutral under present market conditions.
The price of XRPUSD has increased by 1.67% with a price change of $0.006398 in the past 24hrs and has a trading volume of 1.166 billion USD.
We can see a decrease of 14.02% in the trading volumes of Ripple compared to yesterday, which appears to be normal.
This Week Ahead
Ripple continues to move in a strongly bullish momentum above the 0.3800 levels. We are now looking for fresh upsides in the range of 0.4000 and 0.4200
The super trend indicator is giving a bullish reversal signal in the 2-hour time frame indicating the bullish nature of the markets.
We can see a continuous progression of a bullish trend line formation from $0.3564 towards the $0.3904 level.
The support zone is located at $0.3793 which is a 14 day RSI at 50% and at $0.3829 which is a 3-10 day MACD oscillator stalls.
The weekly outlook for Ripple is projected at $0.4200 with a consolidation zone of $0.4100.
FXOpen offers the world's most popular cryptocurrency CFDs*, including Bitcoin and Ethereum. Floating spreads, 1:2 leverage — at your service (additional fees may apply). Open your trading account now or learn more about crypto CFD trading with FXOpen.
*Important: At FXOpen UK, Cryptocurrency trading via CFDs is only available to our Professional clients. They are not available for trading by Retail clients. To find out more information about how this may affect you, please get in touch with our team.
This article represents the opinion of the Companies operating under the FXOpen brand only. It is not to be construed as an offer, solicitation, or recommendation with respect to products and services provided by the Companies operating under the FXOpen brand, nor is it to be considered financial advice.
Stay ahead of the market!
Subscribe now to our mailing list and receive the latest market news and insights delivered directly to your inbox.


Latest articles

Weekly Market Insights with Gary Thomson: The Week of Central Banks and Earnings
In this video, we’ll explore the key economic events and market trends, shaping the financial landscape. Get ready for insights into financial markets to help you navigate the week ahead. Let’s dive in!
In this episode of Market

Intel at a Crossroads: Earnings Beat Meets Technical Resistance
Intel has just delivered its strongest quarter in over fifteen years, and the market reaction says it all. Q2 2026 revenue surged 25% year-over-year to $16.1 billion, crushing the consensus estimate of $14.42 billion, while adjusted EPS of

Tesla: Complex Range Structure Breaks Down Following Quarterly Earnings
Tesla released its Q2 2026 results after the market closed on 22 July. Revenue increased 26% year-on-year to $28.24 billion, while vehicle deliveries reached a record 480,126 units. However, operating margin fell sharply to 1.4%, down from