CAD/JPY Plunges As Bearish Breakout Weighs
The 3rd week of September (15th to 19th sept) has seen upsurge in the price of CAD/JPY where the exchange rate went as high as 99.81, December 2013 high. The price showed a major reversal on 22nd September which lasted till yesterday with the daily close of 97.53. The decline was also supported by the yesterday’s positive economic releases (Tanken Large All Industry CAPEX) by the Bank of Japan. Today, the market looks in favor of bulls that can be further supported with the technical and fundamental outlook.
Technical Analysis
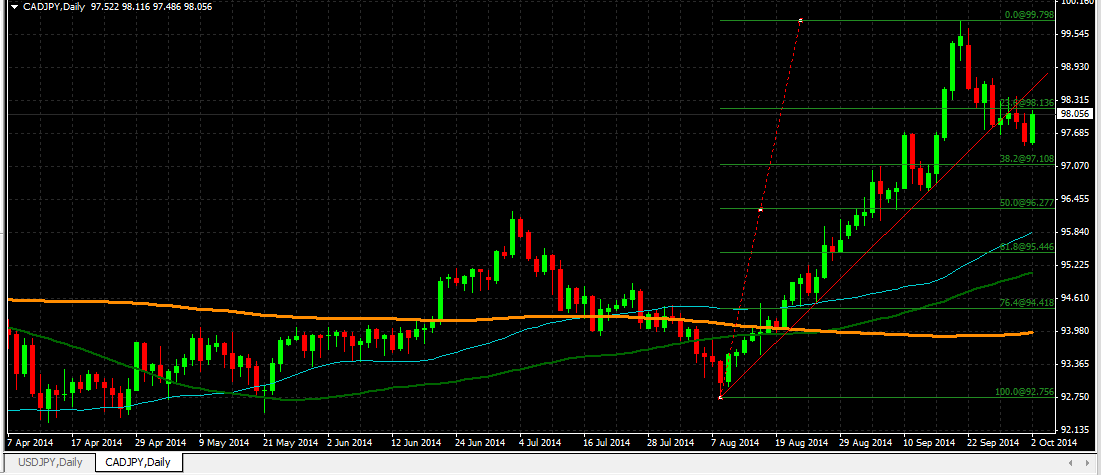
As of this writing, the pair is being traded at 98.04. On the daily candlestick chart, appearance of bullish engulfing candle can be clearly seen which may indicate price reversal at 97.108, the 38.2% fib level or 98.00, the psychological number. In case of price reversal, the price can go up to 98.93 in short to medium term, as indicated by the trend line.
96.61 is the key support level that can halt the tendency of the pair to change its trend. 98.73 is the key resistance level that has to be crossed by the bulls in order to break the September 2014 high.
Fundamental Analysis
Yesterday was an eventful day for the Japanese Yen with the positive economic releases. Today is also marked with the release of Monetary Base Report that measures all the currency supplied by BOJ in circulation.
Monetary Base
Monetary Base report is an important indicator of inflation and is released by the Bank of Japan on monthly basis. The reading for the month of September is 35.3% (below the expectations of economists 38.9%) – while for August it was 40.5%. In general, a high reading is considered bullish for Japanese yen while a low reading is considered bearish.
There is nothing in the economic calendar for today which could have any impact on Canadian dollar. So the current stance may continue with the bulls trying to cross bears.
Trading Strategy
Selling the pair around the broken trendline could be a good strategy in short to medium term.