Can Gold and Crude Oil Prices Gain Momentum?
Gold price is likely forming a base around $1,260 for an upward move. On the other hand, crude oil price is trading with positive signs, but it is approaching a major resistance near $66.80.
Important Takeaways for Gold and Oil
- Gold price found support near $1,260 after a major decline against the US Dollar.
- There was a break above a key bearish trend line with resistance at $1,266 on the hourly chart of gold.
- Crude oil price broke a major bearish trend line at $66.00.
- On the upside, there is a significant resistance near the $66.80 zone
Gold Price Technical Analysis
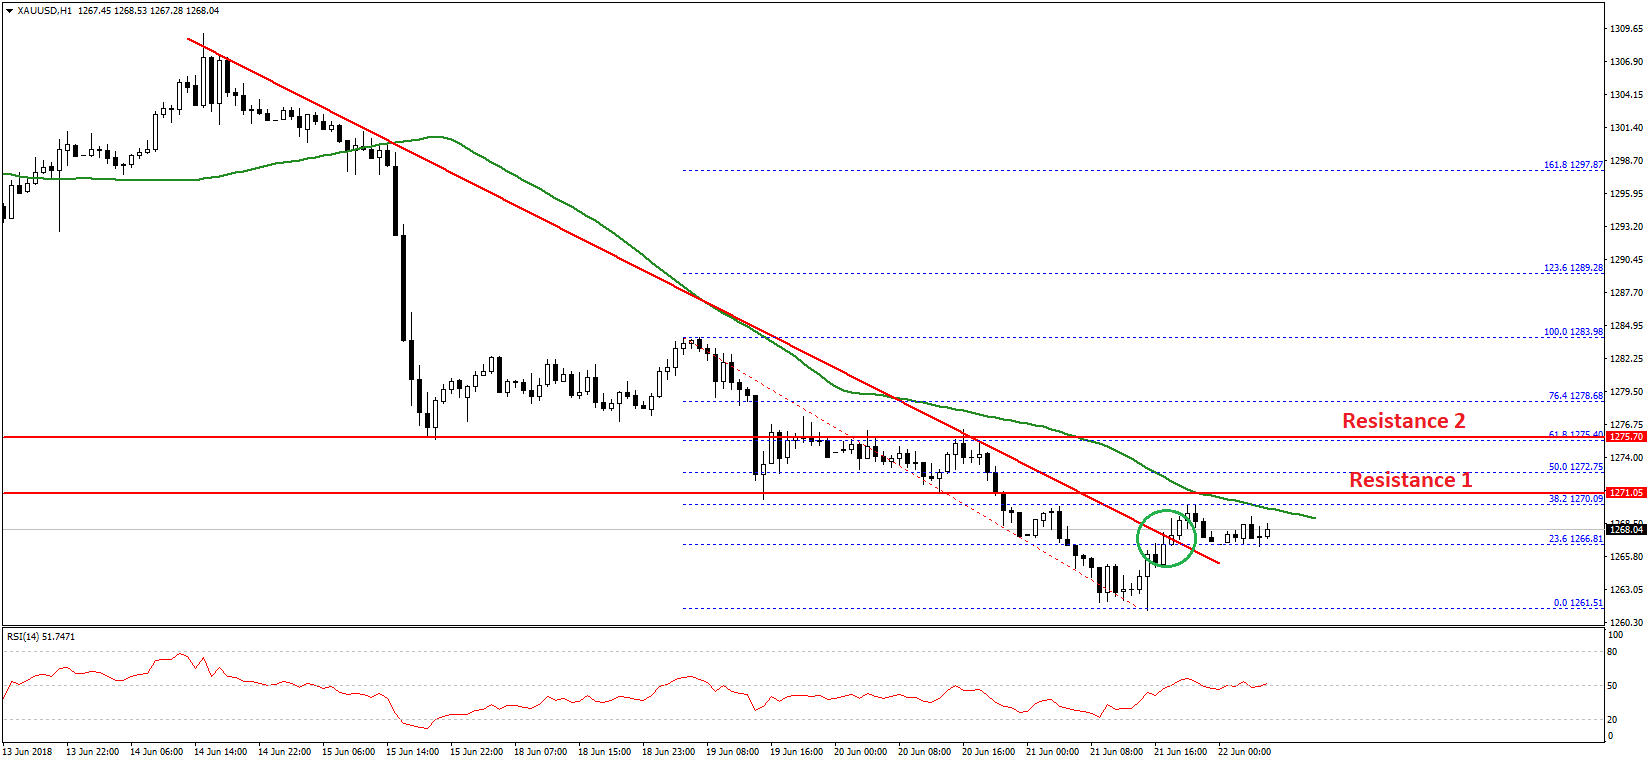
Gold price started a major bearish wave from well above the $1,300 handle against the US Dollar. The price declined and broke many supports, including $1,295, $1,280, $1,275 and $1,270.
The price traded close to the $1,260 level and formed a low at $1,261.51. Later, a support base was formed and the price started an upward correction. It traded higher and broke the 23.6% Fib retracement level of the last drop from the $1,283 high to $1,261 low.
More importantly, there was a break above a key bearish trend line with resistance at $1,266 on the hourly chart of gold. However, the price faced selling interest near the $1,270 level and the 50 hourly simple moving average.
To the topside, there are many resistances around the $1,275 level. The mentioned level was a support earlier, and now it could stop gains towards $1,280. An intermediate resistance is near the 50% Fib retracement level of the last drop from the $1,283 high to $1,261 low at $1,272.
Therefore, it seems like gold price is facing a tough challenge above the $1,272 level. A break and close above $1,275 is required for buyers to gain momentum.
On the downside, the $1,260-1,262 zone is a major support area. As long as the price is above $1,260, it may recover above $1,275.
Oil Price Technical Analysis
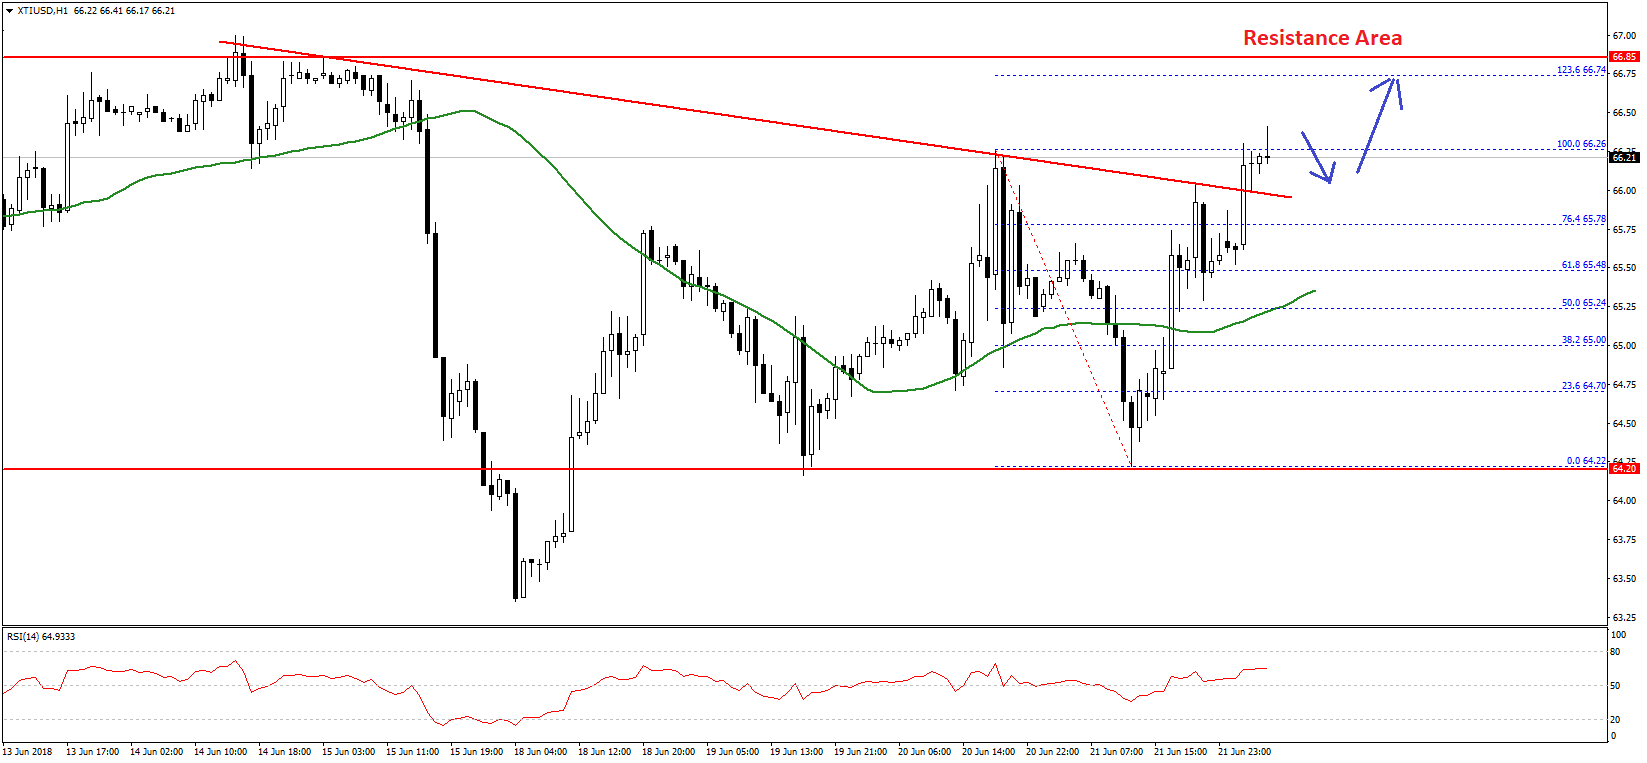
After a few bearish moves, crude oil price formed a decent support at $64.00. A fresh upward wave was initiated and the price moved above the $65.00 resistance and the 50 hourly simple moving average.
The upside move was strong as the price succeeded in clearing the 50% Fib retracement level of the last drop from the $66.26 high to $64.20 low. Moreover, there was a break above a major bearish trend line at $66.00.
It opened the doors for more gains and the price is currently trading near the last swing high of $66.25. It may correct a few points in the near term, but downsides are likely to remain supported above $65.80.
On the upside, the next target for buyers could be around the 1.236 Fib extension level of the last drop from the $66.26 high to $64.20 low at $66.74. Above this, the $66.75-80 zone is a major resistance zone, and therefore, a break above $66.80 won’t be easy.
Should the price succeeds in clearing $66.80, it could break the $67.00 barrier for a push towards $67.50. On the downside, supports are seen at $66.00, $65.80 and $65.50.