


Cryptocurrencies Waiting for Next Move
FXOpen
Cryptocurrencies have been trading aimlessly during the past 7 days. Bitcoin is locked in a small range between $225 and $243. Litecoin has been trading between $1.72 and $1.86 all week. The markets are waiting for the next directional move.
Bitcoin Trading in 7 Percent Range
Bitcoin has been trading in a small 7 percent range between $225 and $243 since February 17th. With the next BTC auction scheduled for March 5th, market participants may prefer a ”wait and see” approach. While the initial announcement last week had little effect on the bitcoin price, the auction itself may be a different matter altogether.
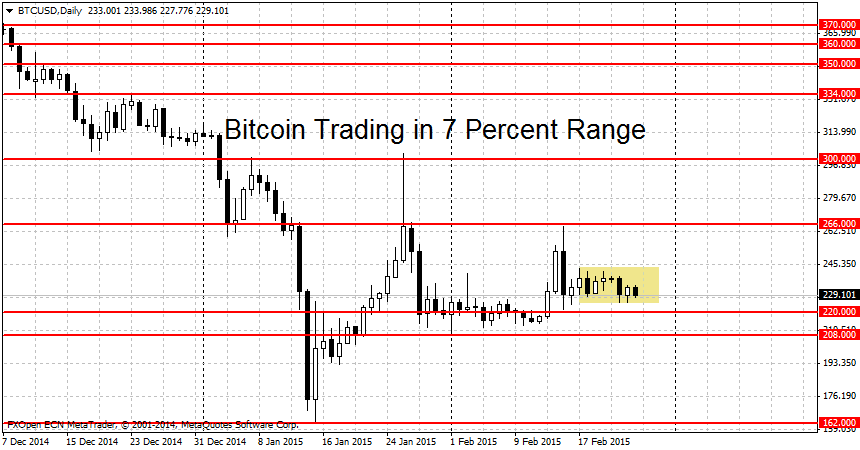
The current congestion area can be seen on the chart above. The crypto-markets have slowed down considerably. Volatility, as measured by the 14 day Average True Range, has trading trading around $13 dollars. This compares to an average of $25 dollars during most of January. While the extremes of the range at $243 and $225 may pose some challenges, a move beyond them may not translate into a bigger move. This is because both of the levels are closely followed by important support/resistance, notably $266 on the top end and $220 on the bottom.
A break above $266 would reignite the stalled rally, while a move below $220 may end it. A clearing of $266 may propel us toward the $300 round figure. Higher up, the next resistance can be found at $334, closely followed by $350. On the lower end, bitcoin will need to take out the $208 swing low to spark a new downtrend. Notable support levels below include $200 and $192, both of them weak levels. Further down, the first important mark is the January 15th swing low at $162 per coin.
One Month of Consolidation for Litecoin
If you think the range-bound trading in bitcoin was bad, take a look at Litecoin. The alternative cryptocurrency spent the last 28 days in a range between $1.66 and $2 dollars. During the past 7 days that range shrunk further to only 14 cents ($1.72-$1.86).
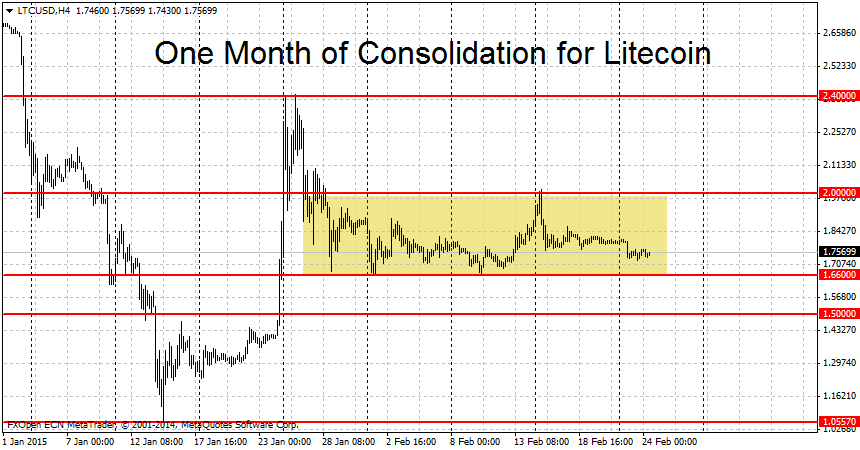
The important levels for LTC/USD are $1.66 on the bottom and $2 on the top. A clearing of either of these price extremes (not just a brief spike above/below) may translate into a larger move. On the higher end, a breakout beyond $2 dollars would open the door to $2.40. On the bottom, a move below $1.66 may see losses toward the round $1.50 mark. Further down, weak support levels include $1.23 and $1.05. The major number to watch on the lower end is the $1 dollar parity level. A breakdown below would intensify the losses.
FXOpen offers the world's most popular cryptocurrency CFDs*, including Bitcoin and Ethereum. Floating spreads, 1:2 leverage — at your service (additional fees may apply). Open your trading account now or learn more about crypto CFD trading with FXOpen.
*Important: At FXOpen UK, Cryptocurrency trading via CFDs is only available to our Professional clients. They are not available for trading by Retail clients. To find out more information about how this may affect you, please get in touch with our team.
This article represents the opinion of the Companies operating under the FXOpen brand only. It is not to be construed as an offer, solicitation, or recommendation with respect to products and services provided by the Companies operating under the FXOpen brand, nor is it to be considered financial advice.
Stay ahead of the market!
Subscribe now to our mailing list and receive the latest market news and insights delivered directly to your inbox.


Latest articles

DAX 40: consolidation amid technology sell-off
A wave of selling in the technology sector that emerged earlier this week has weighed on European equities. The trigger was investor concern over the profitability of large-scale debt-funded investments by major US tech companies in AI infrastructure. The Nasdaq

Euro Hits Fresh Yearly Lows Amid Dovish ECB Signals
The euro remains under pressure following weak macroeconomic data from the euro area and fresh signals that the European Central Bank is prepared to maintain a more accommodative monetary policy stance. Data released yesterday pointed to a deterioration in business

Pound at Key Levels: Markets Assess Impact of Political Uncertainty in the UK
The British pound remains under pressure following increased political uncertainty in the United Kingdom triggered by the Prime Minister’s resignation. Investors are assessing potential shifts in the political and economic policy outlook after the head of government stepped down,