Cryptocurrency crash: Bitcoin drops 17%, Ripple down 21%
BTC/USD
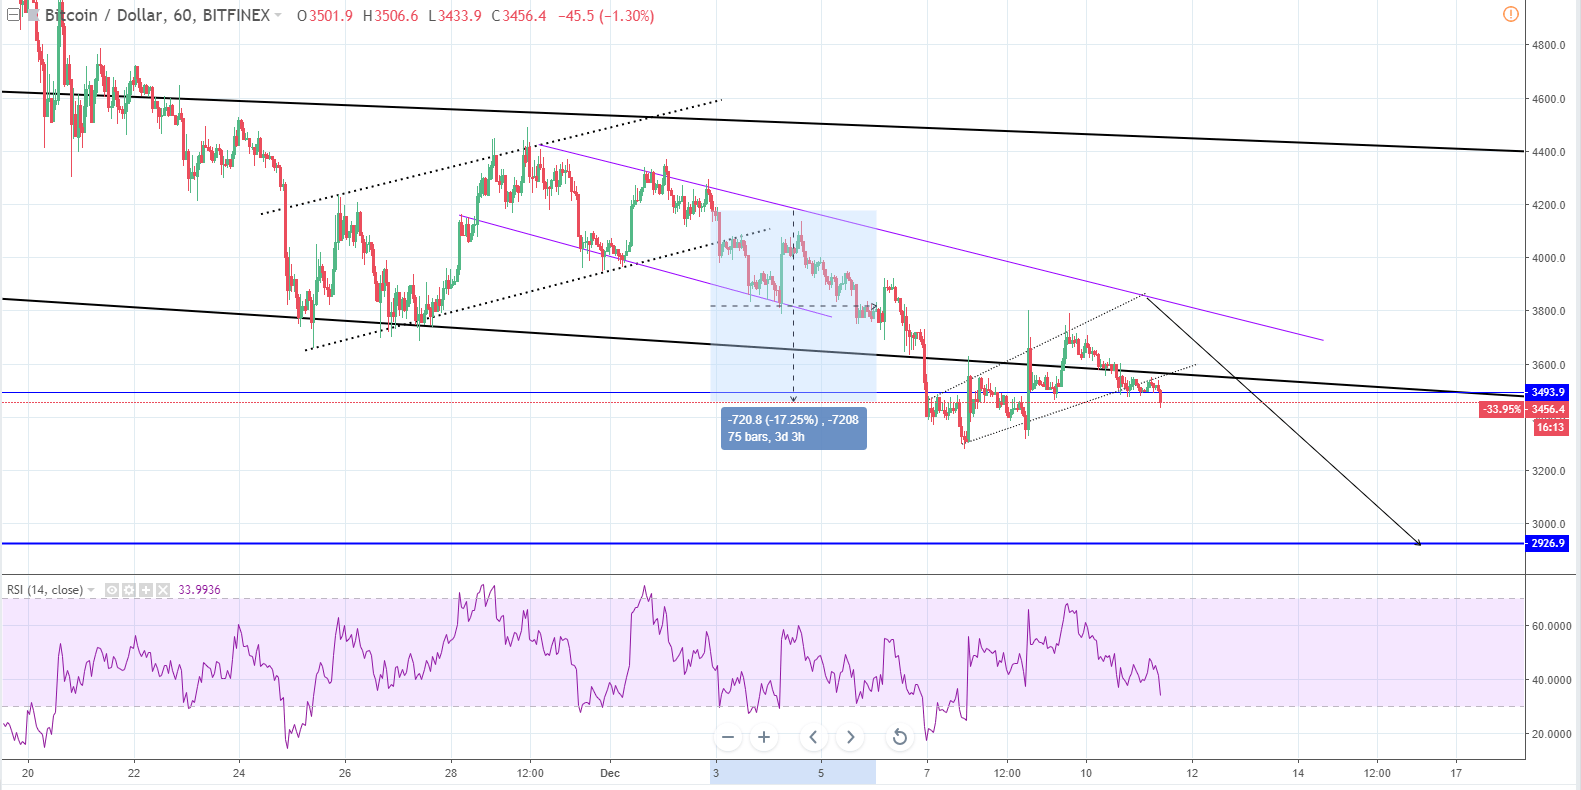
Since last Monday when the price of Bitcoin was at $4178 at the open, the price has decreased by 17.25% measured to the current levels at $3447.9.
Looking at the hourly chart, we can see that the price broke out from the descending channel on the downside and went below two significant support levels – the downtrend support line 2 (bold black line) and the horizontal support level at around $3439, going to $3306 at its lowest point on last Friday, December 7th.
Since the low, the price has come up again to $3710 at its highest point of the week so far. It was the third interaction with the ascending channel’s resistance line, but after the price fell to the horizontal support level at first and has now started to break the level from the downside.
I was expecting one more interaction with the resistance levels from the ascending and prior descending channel before the price goes further but that didn’t happen. Instead, the price didn’t find support at the ascending channel support and the horizontal level making it go lower. But we might see another push to the upside still before a further decrease.
RSI indicator is on 31%, which is the borderline of the oversold range with clear indication that the minor uptrend has been interrupted. So we might see a straight downfall from here with no interaction with the resistance levels.
In either way, more downside is expected for the price of Bitcoin and the next significant level that will serve as support is at $2926.
XRP/USD
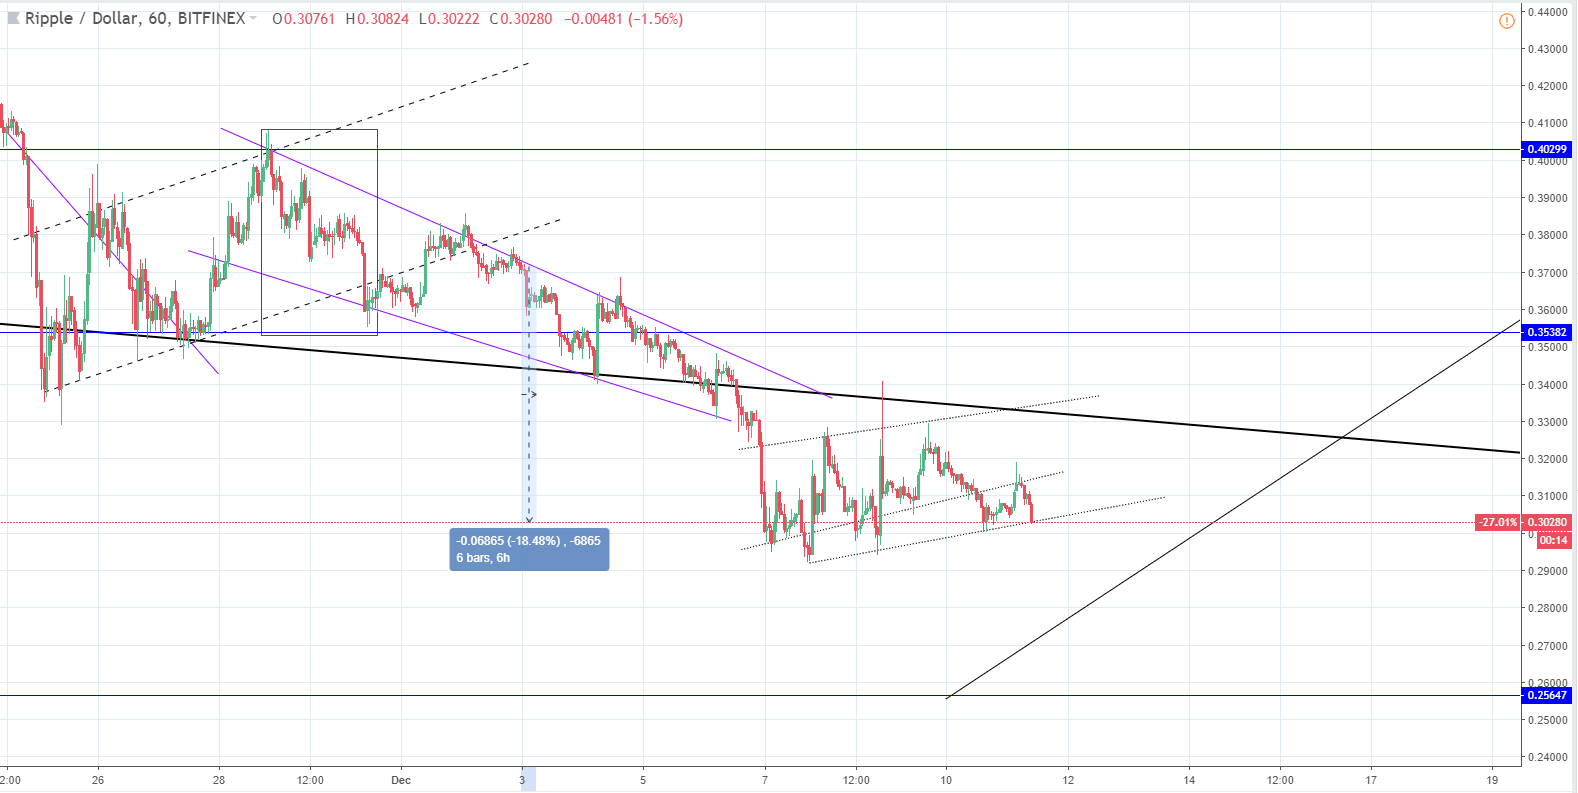
Last Monday, the price of Ripple was $0.37136 at the open. From there the price went on to decrease and has fallen to around $0.29371, which unlike in the case of Bitcoin isn’t the lowest price of Ripple has been since the start of the year.
On the hourly chart, you can see that the price has formed an ascending channel after the fall effectively making a range and the price is currently on its lower levels. From here I would be expecting an interaction with the bold black line, which is the significant downtrend support line, for a retest of resistance after which I would be expecting the price of Ripple to fall to $0.25647, which is the next horizontal significant level in line.
The mentioned significant horizontal support level is the level price of Ripple has been lowest since the start of the year and the price previously interacted with it two times and found support there, from where the price increased thereon and reached $0.6289. So this level serves as strong support and likely will do so in the future.