Dash Trends Lower, ETH Still Flat
The altcoin market has been under pressure recently after bitcoin’s break above $600. Ether’s break above 0.02122 BTC fizzled out quickly while Dash continued the slow trend lower. A lot of what happens next will depend on big brother. A continuation of the BTC rally could sink our two alts further, while a dip back below $600 would likely have the opposite effect.
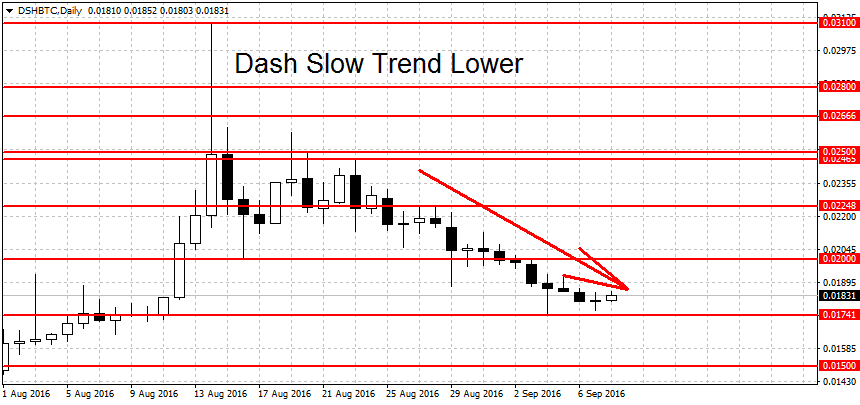
Dash Slowly Trends Lower
Dash is slowing losing ground. We’re now quoted at 0.01831 BTC, substantially below the 0.02282 price noted in our last DSH/BTC update. The losses have been slow but systemic, with 10 red candles during the last 14 days.
We have now entered a short-term downtrend for Dash. Support below here can be found at this month’s low of 0.1741 BTC, followed by the 0.015 round figure. Further down we have some support at the 0.01389 spike high and the 0.01267 June high. As usual these numbers should not be treated as exact levels but more of support/resistance areas.
On the upside, a breakout above the 0.02248 high would end the downtrend. Resistance levels higher up can be found at 0.02465, 0.025 and 0.0266 BTC. A breakout above this swing high could propel us toward the all-time highs (on Poloniex) at 0.028. While the short-term trend says down, both the medium-term and long-term trends for DSH/BTC are bullish.
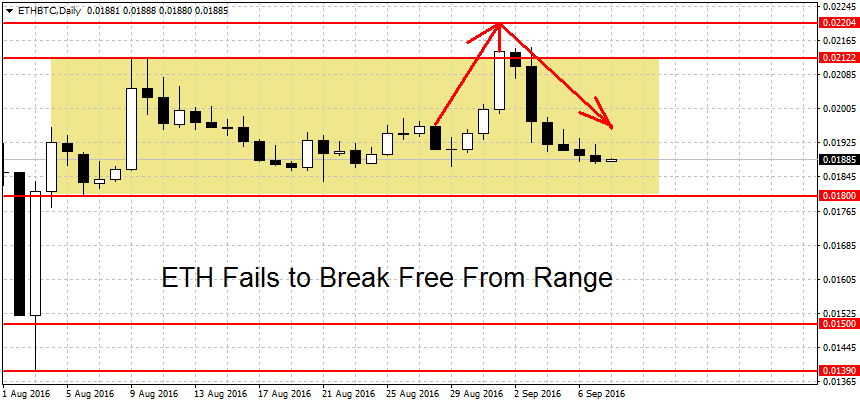
Ether Still in Range
Ether is still trading range-bound. Two weeks ago the coin was quoted at 0.01940 BTC and we’re now trading at 0.01885 BTC. This is a loss of just under 3 percent, a fairly low amount for 14 days. The longer prices remains in a range, the more odds increase that we will eventually see a breakout higher/lower. Let’s take a look at some levels.
The 0.02122 figure noted last time as a potential trend starter was easily broken. But prices failed soon after hitting a high of 0.02204 BTC on September 1st. This is now the new level to watch. A break above here could lead to a new uptrend. Higher still there’s resistance at 0.2285 and 0.02610 BTC. The levels above continue with the 0.028 and 0.03 round figures.
On the other end the key level remains at 0.018 BTC. A breakdown below this level could start a new downtrend. Support levels can be found at the 0.015 round figure followed by 0.0139, 0.0123 and another round level at 0.01. A decisive break below this milestone figure could lead to more losses.