


FXOpen
The downtrends in ETH/BTC and DSH/BTC continue for another week. Ether is down over 16 percent versus BTC since last Thursday while Dash is down by a smaller 6 percent.
Ether Drops 16 Percent
Ether has dropped over 16 percent in the past seven days and is currently quoted just below the 0.06 round figure. The altcoin has been in a persistent downtrend versus bitcoin since the middle of February, losing over a third of its value during this time. Support below can be found at the latest swing lows around 0.059 and the 0.06 round figure. This is followed by the 0.05405 swing low and the 0.05 BTC round figure.
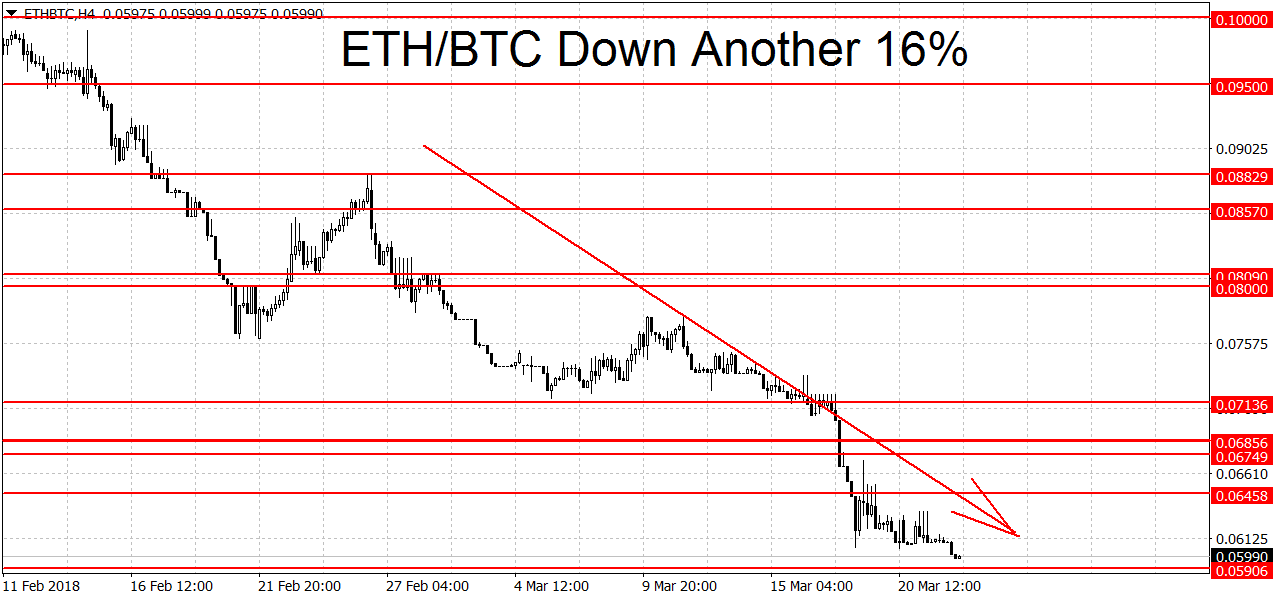
To end the bleeding the bulls will have to push prices above the 0.08 BTC round figure. A breakout above this important milestone would also shift the trend from down to up. Below here some resistance can be seen around the 0.071 BTC area. Here we have a ‘meeting’ of former swing highs and swing lows. Higher up we have more resistance around the 0.0857 level and the 0.08829 swing high. On the weekly charts ETH/BTC is now range-bound. The monthly charts are still keeping the bullish bias.
Dash Down 6 Percent
Dash prices are down from 0.049 BTC to 0.046 BTC today, or around 6 percent. With the break below the 0.05513 BTC swing low Dash moved in a downtrend. Below current prices there’s a support area stretching from the 0.0447 swing low to this month’s swing low at 0.045 BTC flat. A clearing of this area may open the door to more losses. Further down we find stronger support levels around the 0.03557 and 0.03452 swing lows. To end the current downward trend we need to see a break and stabilization back above 0.05513 BTC.
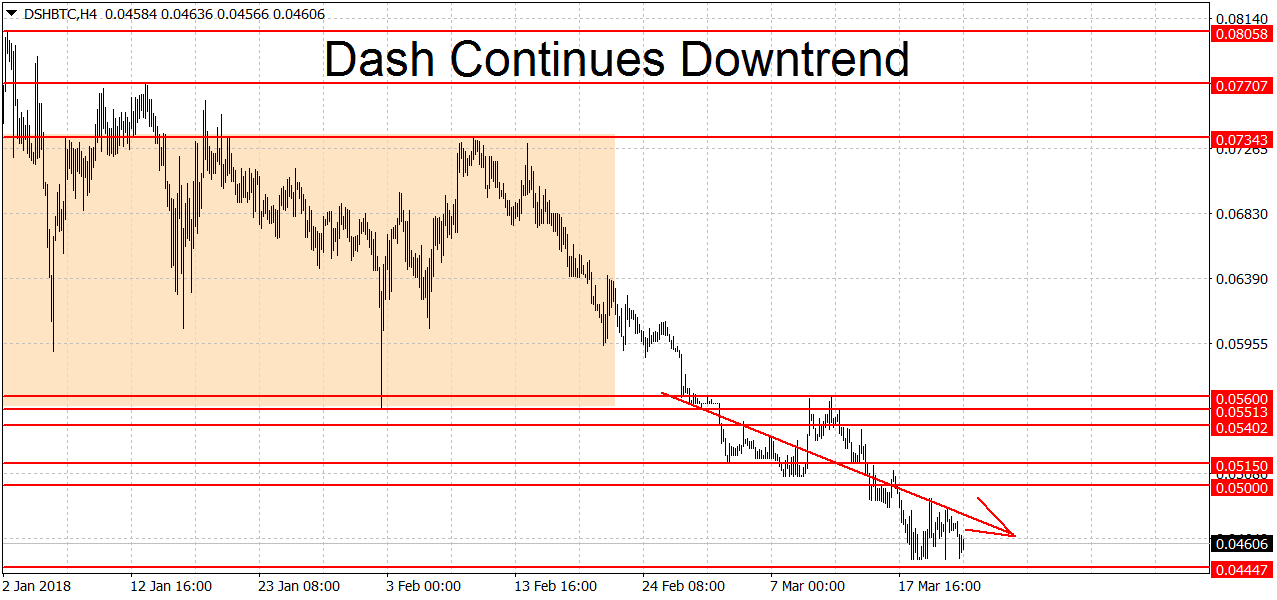
A new uptrend may commence with a breakout above 0.056 BTC per coin. Resistance higher up can be found at the 0.07343 swing high, followed by the 0.07707 BTC swing high. Close to here we have another resistance at 0.08058 BTC. Higher still we find more resistance levels at 0.08572 BTC , 0.087 BTC and 0.09099 BTC. The 0.1 BTC round figure is another notable resistance point. Just like Ether, on the longer-term charts DSH/BTC is range-bound on the weekly but bullish on the monthly.
FXOpen offers the world's most popular cryptocurrency CFDs*, including Bitcoin and Ethereum. Floating spreads, 1:2 leverage — at your service (additional fees may apply). Open your trading account now or learn more about crypto CFD trading with FXOpen.
*Important: At FXOpen UK, Cryptocurrency trading via CFDs is only available to our Professional clients. They are not available for trading by Retail clients. To find out more information about how this may affect you, please get in touch with our team.
This article represents the opinion of the Companies operating under the FXOpen brand only. It is not to be construed as an offer, solicitation, or recommendation with respect to products and services provided by the Companies operating under the FXOpen brand, nor is it to be considered financial advice.
Stay ahead of the market!
Subscribe now to our mailing list and receive the latest market news and insights delivered directly to your inbox.


Latest articles

Dollar Index (DXY) Hits Yearly High
Today, the dollar index rose above last week’s peak around the 99.68 level, setting a new high for 2026. This movement is supported by a tense fundamental backdrop:
→ Inflationary pressures from rising oil prices. Markets may be pricing

WTI Oil Price Rises Above $100
Another shocking Monday for the energy market. Last week’s start was remembered for a bullish gap of more than 10% (which was later followed by a pullback), but today’s market open proved even more volatile (as reflected by

Market Analysis: AUD/USD and NZD/USD Struggle as Market Jitters Shake Risk Sentiment
AUD/USD failed to stay in a positive zone and declined below 0.7000. NZD/USD is also moving lower and might extend losses below 0.5850.
Important Takeaways for AUD/USD and NZD/USD Analysis Today
· The Aussie Dollar