


Draghi scratched easing plans while BoJ is optimistic - EUR/USD, USD/JPY outlook.
FXOpen
EUR/USD shows some action during holiday Monday
Volumes are thin but volatility seems choppy after Mario Draghi’s comments this morning that sounded far less dovish than during ECB press conference in May which triggered euro selloff.
Today we were expecting tight range till tomorrow London open but traders brought the pair above 1.3634 resistance / today’s Pivot Point.
Still, we see weakness of today’s market and we anticipate possible fade of any move higher, i.e. towards 1.3650/53 resistance – Friday high, Pivot R2, 50% of Thursday and Friday selloff.
In case of a prolonged upward retracement we see some decent supply area at 1.3677/88 – Thursday high, 16th, 19th, 20th May low, trend line on May 19th-21st heights.
More demand could arise in 1.3630/10 area or lower 1.3600 – 1.3570 which are significant levels in medium term.
We don’t think that traders would wind price up above 1.3690 before ECB meeting scheduled on June 5th, because it would mean that they don’t want to sell Euro anymore while uncertainty about ECB behavior is pretty high. Therefore this week might end up in just 80 pips range between 1.3610-1.3690.
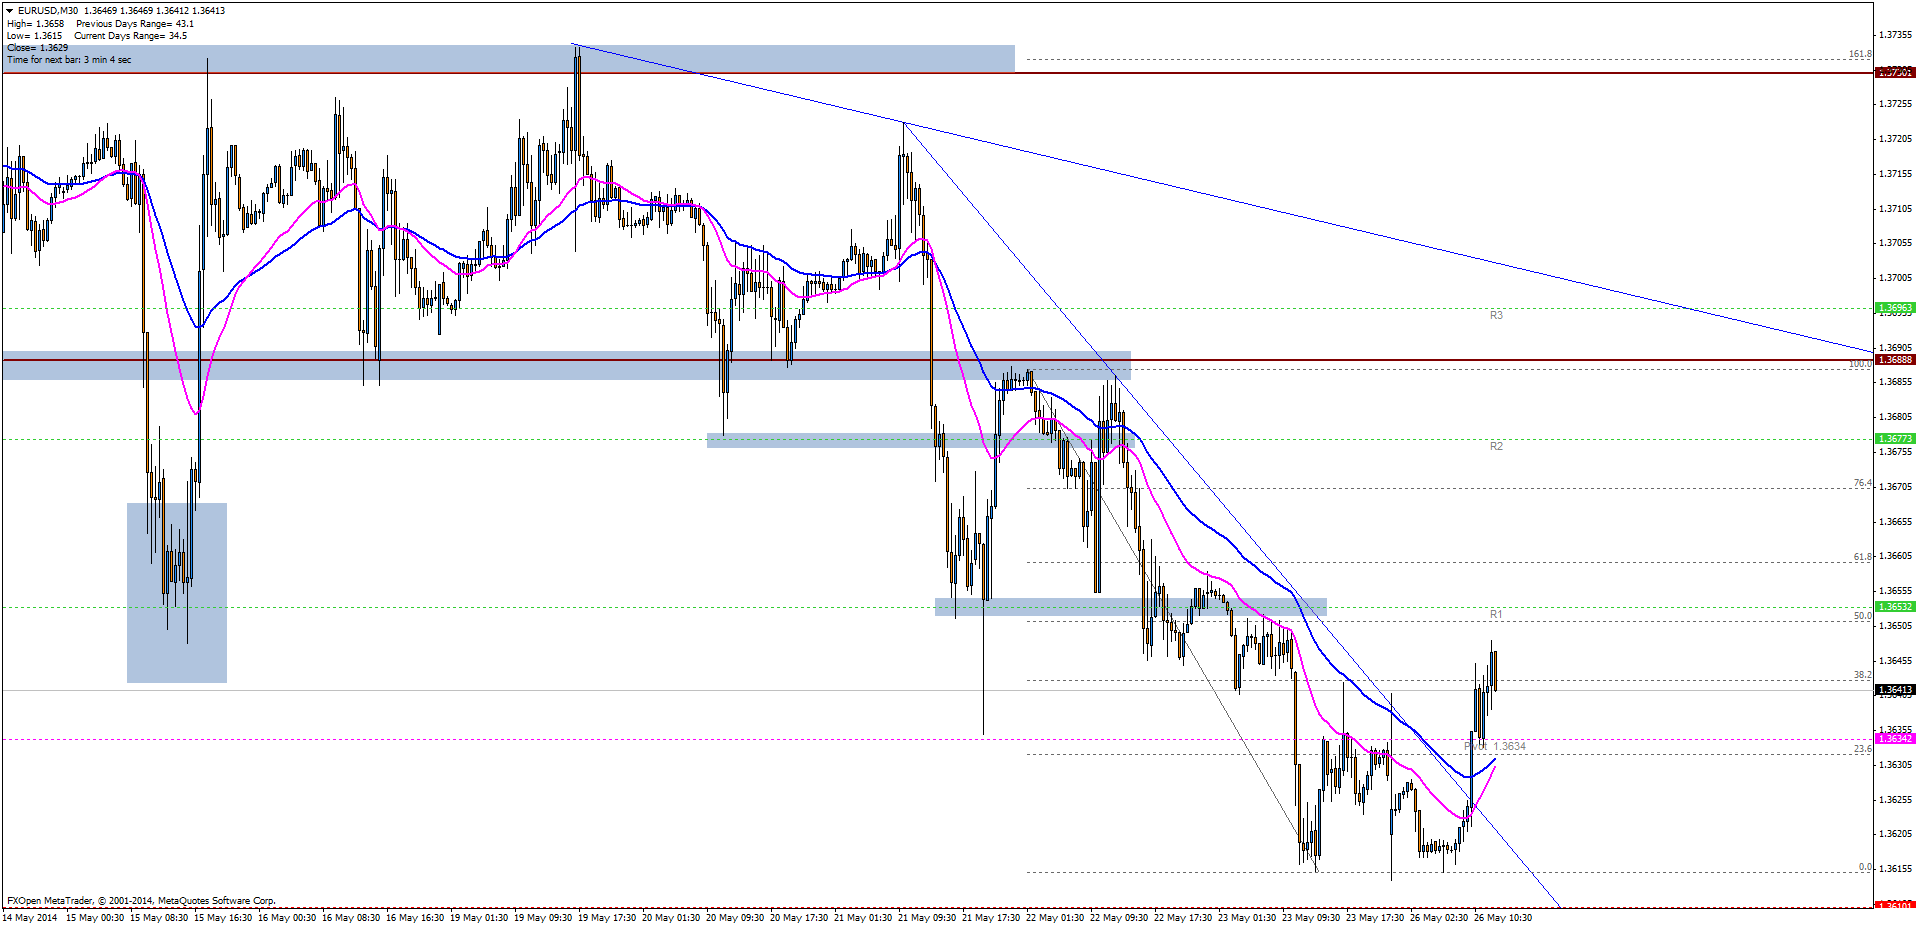
EUR/USD 30-minutes | Click to enlarge.
USD/JPY is in a good mood
Last week’s Price Action was clearly two ways – started with selling pressure, the pair has been bought all the way up – creating significant weekly upward Pinbar candle. This PA signal which occurred on a long term ascending trend line, 200 Daily Moving Average and important medium term support area 101.30-100.70, near 50% of a October to December rally, tells us that market is about to add longs around these levels.
Trying to set some targets we have recent May’s high at 103.00 which is crossed by descending trend line attached to January/February and April heights. Secondary target might be spotted at 104.10 and another one at 105.40.
On the other hand many analysts see possible downward move towards one of long term support areas:
99.50 – 19th November ’13 low, ~61,8% of recent wave up
96.70 – October ’13 low
94.00 – June ’13 low
To confirm our upward bias we would like to see 102.00 broken and confirmed as Fibonacci retracement tool shows us the 38.2% level of a mentioned 4Q2013 rally exactly at 102.06 but also some local trend lines are crossing there.
Macro data this week will shed some light on a US recovery especially Durable Goods Orders on Tuesday and preliminary GDP data on Thursday. Also some impact may come from Friday Japanese data which includes Industrial Production, CPI and several other economic indicators. However last Bank of Japan minutes were pretty optimistic showing improvement both in domestic and overseas economies and strong domestic demand in Japan. If this outlook will be confirmed it might boost risk appetite and press Yen down.
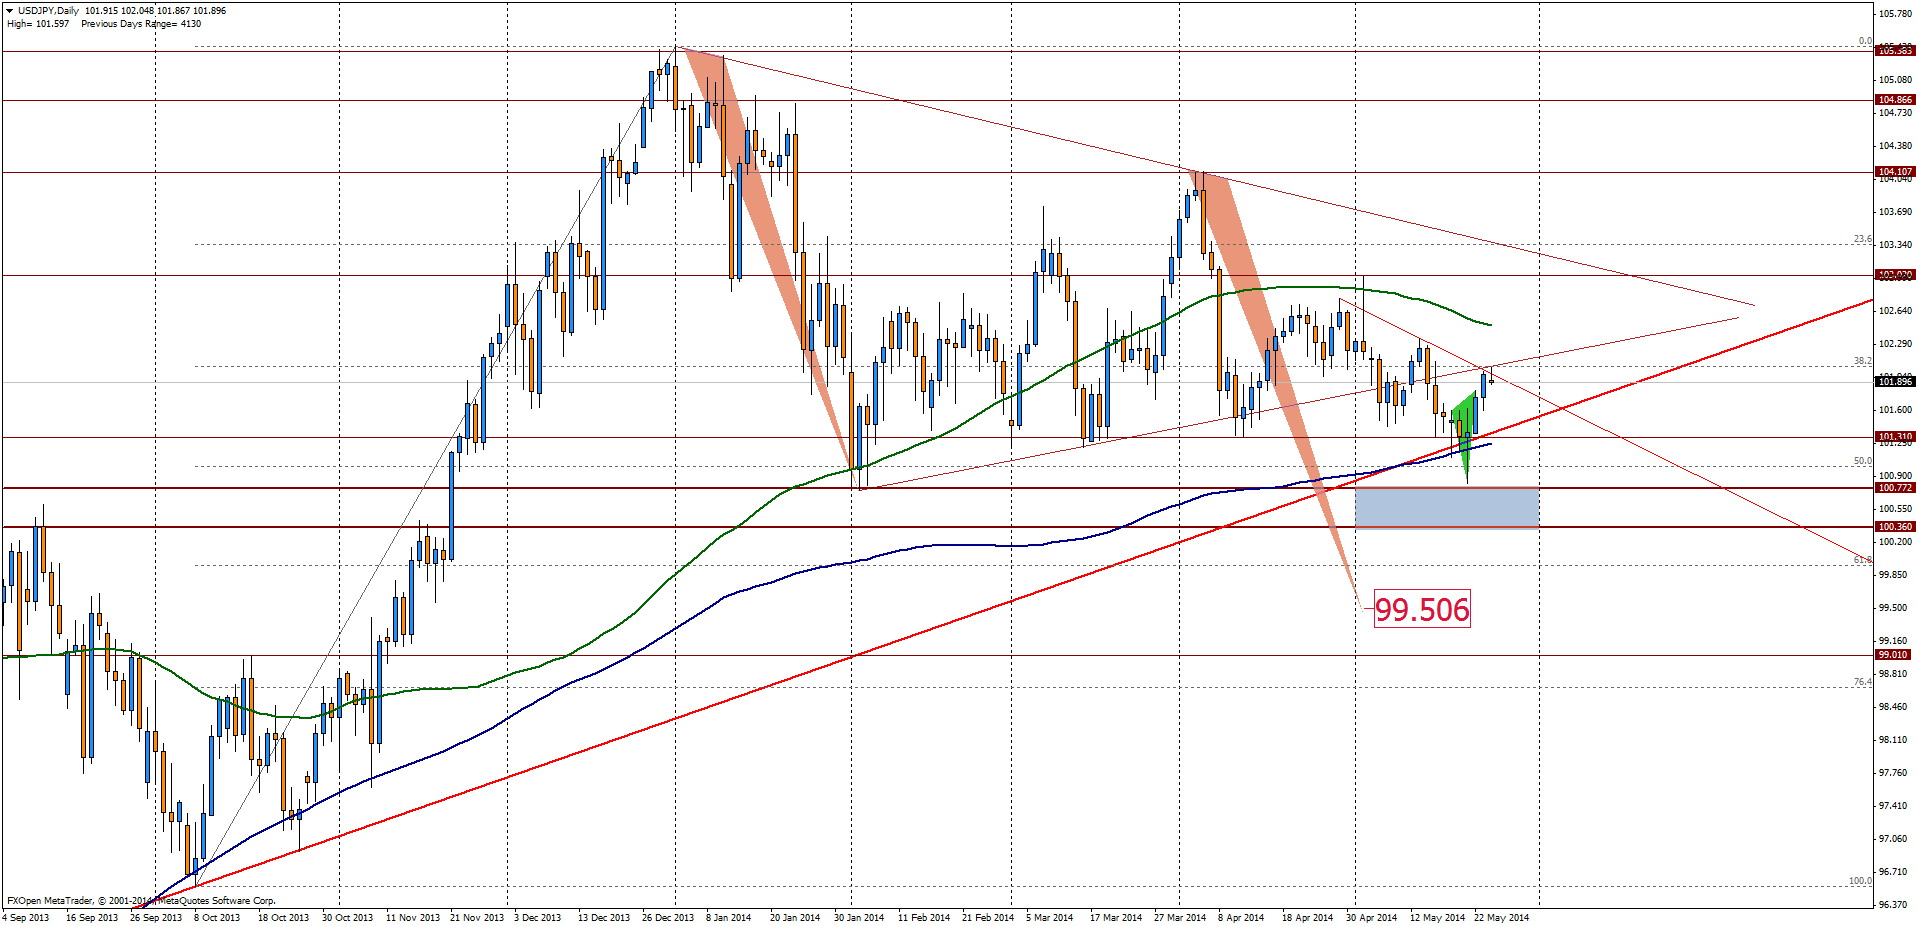
USD/JPY daily | Click to enlarge!
Trade over 50 forex markets 24 hours a day with FXOpen. Take advantage of low commissions, deep liquidity, and spreads from 0.0 pips (additional fees may apply). Open your FXOpen account now or learn more about trading forex with FXOpen.
This article represents the opinion of the Companies operating under the FXOpen brand only. It is not to be construed as an offer, solicitation, or recommendation with respect to products and services provided by the Companies operating under the FXOpen brand, nor is it to be considered financial advice.
Stay ahead of the market!
Subscribe now to our mailing list and receive the latest market news and insights delivered directly to your inbox.


Latest articles

EUR/USD Eyes Gains As USD/CHF Weakness Deepens Again
EUR/USD started a fresh increase above 1.1700 and 1.1720. USD/CHF declined further and is now struggling below 0.7835.
Important Takeaways for EUR/USD and USD/CHF Analysis Today
· The Euro started a decent increase from

Apple: Earnings Day Above the Activity Zone
On 30 April, after the market close, Apple Inc. will release its financial results for the second quarter of fiscal 2026. The consensus forecast, based on estimates from 31 analysts, points to revenue of around $109.7 billion, with expected

USD/JPY and USD/CHF Near Key Levels: The Dollar Supported by the Fed
The US dollar continues to trend upwards following the Federal Reserve meeting, drawing support from the regulator’s moderately hawkish stance and comments by Jerome Powell. Markets interpret the Fed’s rhetoric as a signal that restrictive policy is likely