


Ether, Dash Mostly Range-bound
FXOpen

Ether and Dash have traded mostly range-bound during the previous two weeks. Ether is up by 1.8 percent since our previous update while Dash is down by 2.5 percent.
Ether Slightly Higher
Ether is quoted at 0.03972 right now, from 0.039 flat in our previous ETH article. In percentage terms, this is a move of only 1.8 percent. This is a very low price change for two weeks in the crypto-world. It underscores the current neutral state of ETH/BTC.
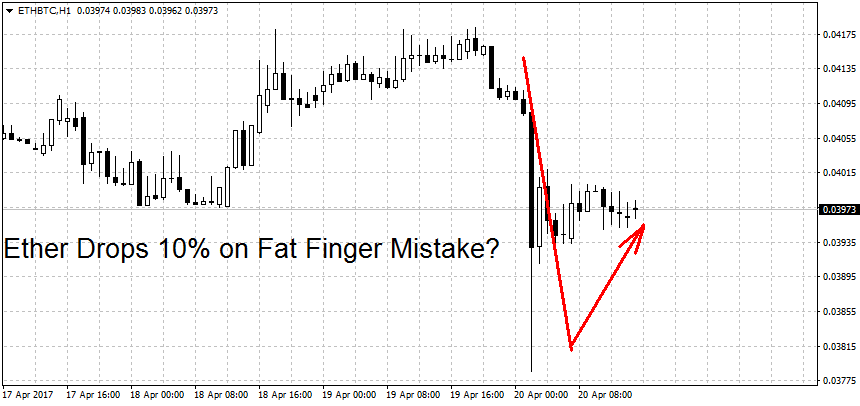
On the price chart above you can see a large 10% spike down that happened in early morning trading today. It appears that this was a market order gone wrong or a fat finger mistake. The initial crash was retraced by 5% almost instantly and the price is now down by only 2.5 percent on the day.
To start a new rally the bulls will have to push ETH above the 0.05 round figure. On the lower end the number ‘to beat’ is this month’s low at 0.03383. A decisive breakdown below here could start a new downtrend for Ether. Above here the prior swing highs at 0.0469 and 0.436 BTC could provide some resistance, as well as at the 0.0456 swing low. While the daily trend shifted in neutral, the weekly and monthly charts remain bullish for ETH/BTC.
Dash Drops by 2.5 Percent
Dash traded as low as 0.04771 since our last update. Since then the coin bounced a bit and is trading at 0.05869 BTC right now. It appears that Kraken adding it to its exchange provided a bit of a bump here. Prices advanced over 20 percent on that day. But the current price level is still down from 0.06018 two weeks ago. This is a drop of 2.5 percent. Nothing major but it continues the already established downtrend in this crypto-currency.
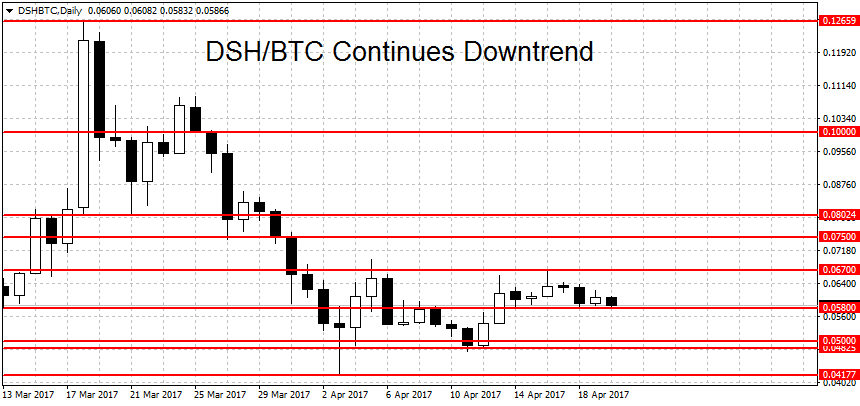
However, DSH/BTC is nearing a level which may end the current trend. A decisive breakout above the 0.067 BTC level could end the downtrend. A move above 0.075 is needed to start a new uptrend.
On the lower end, support can be found at the 0.05 BTC round figure, followed by a stronger level at the 0.04825 swing high and 0.04177, last month’s low for DSH/BTC. We have more support bellow here at 0.315, 0.02879 and 0.02478 BTC. The breakout point for the previous rally at 0.0175 now acts as a support to falling prices. While the daily trend is still bearish, the weekly and the monthly charts remain in bullish mode.
Start trading crypto currency markets today with FXOpen.
FXOpen offers the world's most popular cryptocurrency CFDs*, including Bitcoin and Ethereum. Floating spreads, 1:2 leverage — at your service (additional fees may apply). Open your trading account now or learn more about crypto CFD trading with FXOpen.
*Important: At FXOpen UK, Cryptocurrency trading via CFDs is only available to our Professional clients. They are not available for trading by Retail clients. To find out more information about how this may affect you, please get in touch with our team.
This article represents the opinion of the Companies operating under the FXOpen brand only. It is not to be construed as an offer, solicitation, or recommendation with respect to products and services provided by the Companies operating under the FXOpen brand, nor is it to be considered financial advice.
Stay ahead of the market!
Subscribe now to our mailing list and receive the latest market news and insights delivered directly to your inbox.


Latest articles

EUR/USD Eyes Gains As USD/CHF Weakness Deepens Again
EUR/USD started a fresh increase above 1.1700 and 1.1720. USD/CHF declined further and is now struggling below 0.7835.
Important Takeaways for EUR/USD and USD/CHF Analysis Today
· The Euro started a decent increase from

Apple: Earnings Day Above the Activity Zone
On 30 April, after the market close, Apple Inc. will release its financial results for the second quarter of fiscal 2026. The consensus forecast, based on estimates from 31 analysts, points to revenue of around $109.7 billion, with expected

USD/JPY and USD/CHF Near Key Levels: The Dollar Supported by the Fed
The US dollar continues to trend upwards following the Federal Reserve meeting, drawing support from the regulator’s moderately hawkish stance and comments by Jerome Powell. Markets interpret the Fed’s rhetoric as a signal that restrictive policy is likely