


Ether Downtrend Ends
FXOpen
The Ether downtrend versus BTC ended yesterday as prices climbed back above the 0.037 level. Dash also clawed back a lot of the earlier losses but remains in a downtrend vs bitcoin.
Ether Downtrend Ends
The short-lived downtrend in ETH is over after prices decisively broke the previous support turned resistance at 0.03712 BTC. Yesterday we hit a high of 0.044 BTC before the pair retraced somewhat. We are currently trading at 0.03968 BTC.
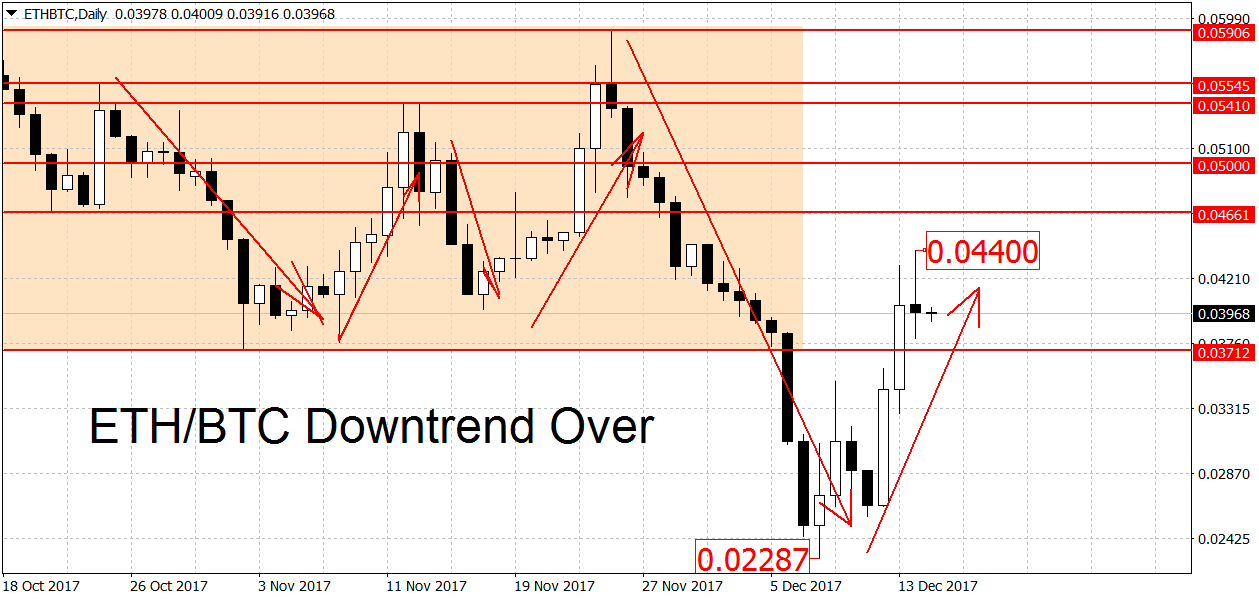
With the end of the latest downtrend, ETH/BTC is back in a large range. A new uptrend requires a break above the 0.05906 BTC swing high. For a restart of the downtrend, the bears will have to push prices below the 0.02287 swing low.
Support on the way down can be found at the former support turned resistance now turned back to support at 0.03712. However note that this level will now act as much weaker support then it was before the break last week. On the top side we find potential resistance at the 0.044 swing high (weak) followed by 0.04661 BTC and the 0.05 round figure. On the long-term charts the picture is mixed with a bearish trend on the weekly but bullish on the monthly.
Dash Clawsback Some Losses
Since our last update Dash successfully clawed back some of the large losses. It’s now up over 37 percent since last Thursday. Still the gains haven’t been enough to end the current downtrend. For that to happen the bulls will have to push DSH/BTC above the 0.066 level. A decisive break of 0.8018 BTC swing high could start a new uptrend in prices.
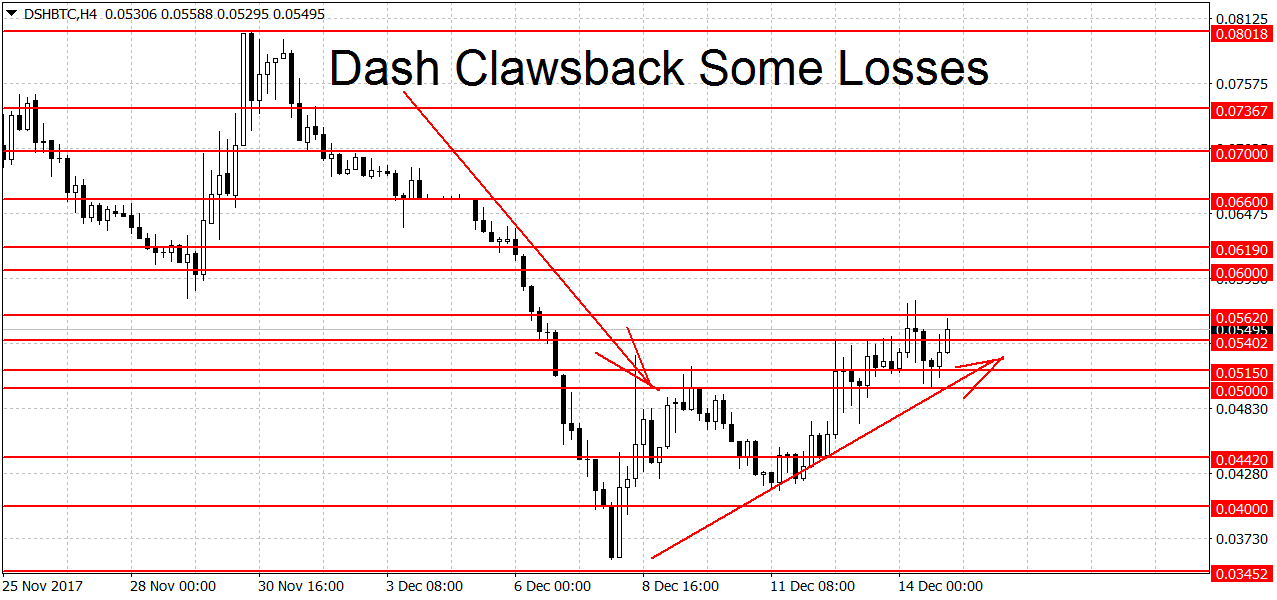
Support below can be found at 0.05402, 0.0515 BTC and the 0.05 round figure. Lower still we find more potential levels at 0.0442, the 0.04 round figure and the most recent swing low at 0.03557. The eight-month low at 0.03452 BTC is another notable support level.
Higher up we have resistance at the most recent swing high of 0.0547 BTC (weak) followed by 0.0576 and the 0.06 round figure. Similarly to ETH/BTC, on the long-term charts the picture is mixed with a bearish trend on the weekly but a bullish trend on the monthly.
Open a Crypto account and join FXOpen – one of the leading cryptocurrency trading brokers.
FXOpen offers the world's most popular cryptocurrency CFDs*, including Bitcoin and Ethereum. Floating spreads, 1:2 leverage — at your service (additional fees may apply). Open your trading account now or learn more about crypto CFD trading with FXOpen.
*Important: At FXOpen UK, Cryptocurrency trading via CFDs is only available to our Professional clients. They are not available for trading by Retail clients. To find out more information about how this may affect you, please get in touch with our team.
This article represents the opinion of the Companies operating under the FXOpen brand only. It is not to be construed as an offer, solicitation, or recommendation with respect to products and services provided by the Companies operating under the FXOpen brand, nor is it to be considered financial advice.
Stay ahead of the market!
Subscribe now to our mailing list and receive the latest market news and insights delivered directly to your inbox.


Latest articles

EUR/USD Eyes Gains As USD/CHF Weakness Deepens Again
EUR/USD started a fresh increase above 1.1700 and 1.1720. USD/CHF declined further and is now struggling below 0.7835.
Important Takeaways for EUR/USD and USD/CHF Analysis Today
· The Euro started a decent increase from

Apple: Earnings Day Above the Activity Zone
On 30 April, after the market close, Apple Inc. will release its financial results for the second quarter of fiscal 2026. The consensus forecast, based on estimates from 31 analysts, points to revenue of around $109.7 billion, with expected

USD/JPY and USD/CHF Near Key Levels: The Dollar Supported by the Fed
The US dollar continues to trend upwards following the Federal Reserve meeting, drawing support from the regulator’s moderately hawkish stance and comments by Jerome Powell. Markets interpret the Fed’s rhetoric as a signal that restrictive policy is likely