


Ether Nears Breakout, Dash Down
FXOpen

We got a mixed bag today. While Ether is up against bitcoin, Dash is now in a downtrend. As usual, we will first go over ETH/BTC then come back to DSH/BTC later in the article. We have a bitcoin update at the end of this article as well.
Ether Nears Breakout
Ether prices have gone up almost 10 percent since our last update. We have since broken above the 0.0844 swing high and thus ended the downtrend. Back then we penned the 0.111 spikes high as a potential trend starter. Now that level is moved slightly lower to yesterday’s high at 0.09322.
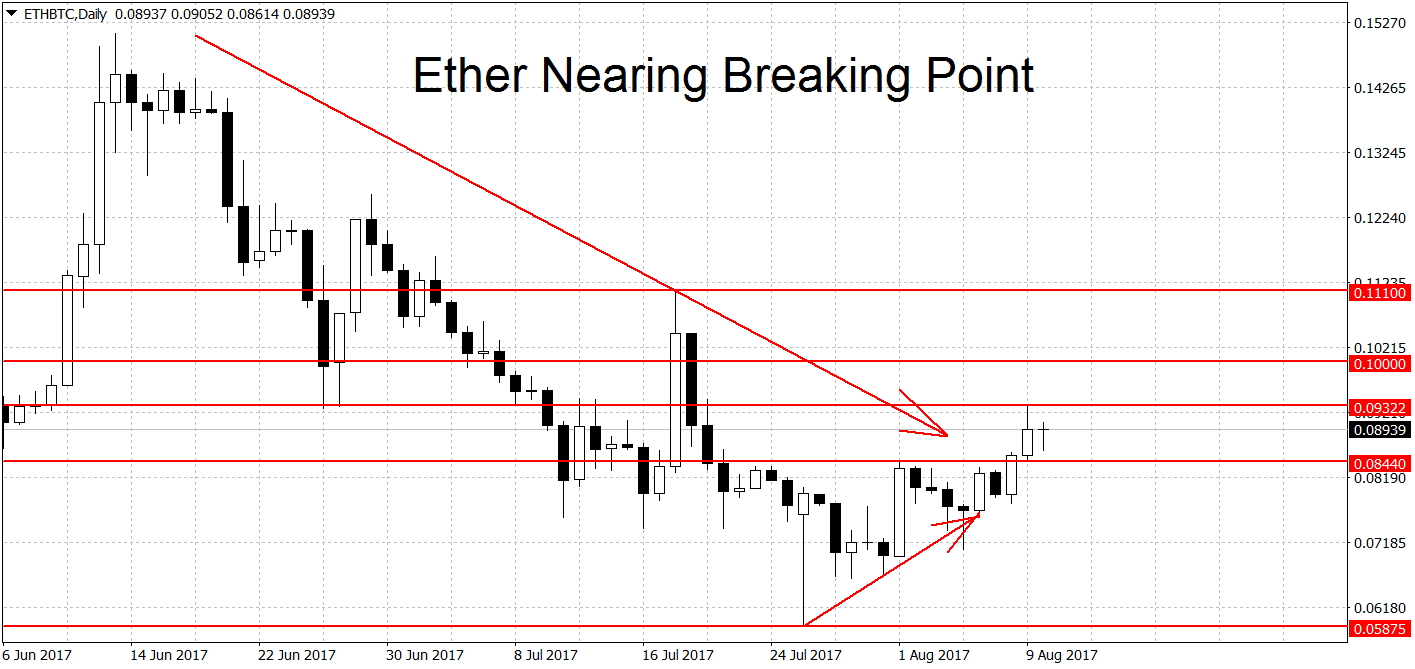
A decisive breakout above here could start a new ETH rally versus BTC. Resistance above here can be found at the 0.10 BTC round figure and the 0.111 spike high. On the lower end, we need a move below the 0.05875 swings low for a new downtrend. On the longer-term weekly and monthly charts, ETH/BTC has stayed in a bullish trend for most of this year.
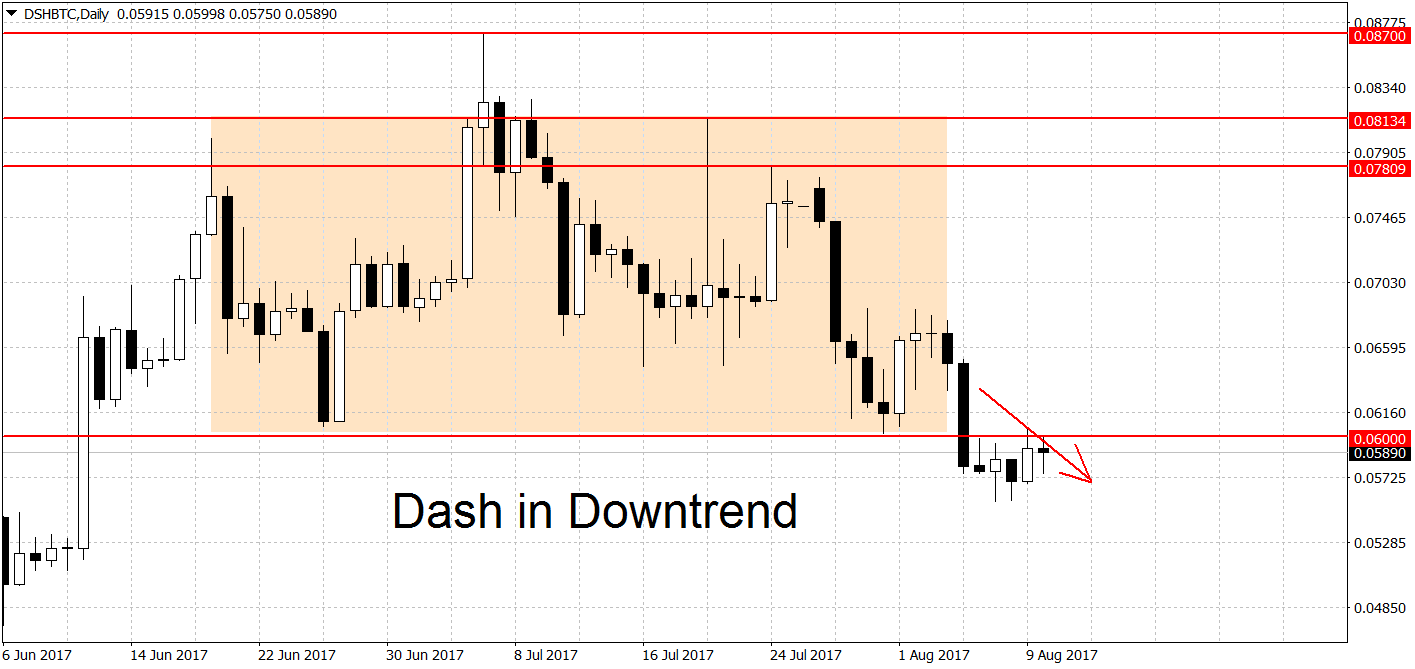
Dash in Downtrend
After some losses during the past seven days, DSH/BTC has now entered a downtrend. We are currently quoted at 0.0589 BTC, below the important 0.06 round figure.
On the way down we have support at the 0.05 round figure. This is followed by a strong support area spanning several previous swing lows at 0.04728, 0.046, 0.0448 and 0.04303 BTC. A decisive breakout below the 0.043 BTC level could exacerbate the losses for Dash.
Higher up the bulls need to break above the 0.06849 swing high to end the current downtrend. A move above 0.08 is needed for a new rally. Similarly to Ether, DSH/BTC has been in an uptrend on the weekly and monthly charts for most of 2017.
Bitcoin Stable After Segwit Activation
Bitcoin prices have remained stable during the past two days, albeit with high volatility. We’re currently quoted at $3,390 dollars per coin, only $7 above the price during our Tuesday update.
The bullish trend remains unchanged. A break below the $2,573 swing low is needed to end it. On the other end, a break above the $3,500 round figure could lead to extended gains. For more bitcoin levels, take a look at our previous article HERE. On the weekly and monthly charts, BTC/USD is in rally mode as well.
If you know how to trade cryptocurrencies, join FXOpen.
FXOpen offers the world's most popular cryptocurrency CFDs*, including Bitcoin and Ethereum. Floating spreads, 1:2 leverage — at your service (additional fees may apply). Open your trading account now or learn more about crypto CFD trading with FXOpen.
*Important: At FXOpen UK, Cryptocurrency trading via CFDs is only available to our Professional clients. They are not available for trading by Retail clients. To find out more information about how this may affect you, please get in touch with our team.
This article represents the opinion of the Companies operating under the FXOpen brand only. It is not to be construed as an offer, solicitation, or recommendation with respect to products and services provided by the Companies operating under the FXOpen brand, nor is it to be considered financial advice.
Stay ahead of the market!
Subscribe now to our mailing list and receive the latest market news and insights delivered directly to your inbox.


Latest articles

US Dollar Index: A Defining Week for the King of the Markets
The dollar heads into a pivotal week trading near 101.80, just off a 15-month high, with the Fed's July 29 meeting standing as the clear focal point. Markets currently price roughly a 65% chance of a hold, though renewed

NZD/USD: Inflation Surge Meets Strong US Dollar Pressure
On 21 July, Stats NZ reported an acceleration in inflation: the Consumer Price Index rose 1.5% in the second quarter, while the annual inflation rate climbed to 4.1%, its highest level in more than two years and slightly

Weekly Market Insights with Gary Thomson: The Week of Central Banks and Earnings
In this video, we’ll explore the key economic events and market trends, shaping the financial landscape. Get ready for insights into financial markets to help you navigate the week ahead. Let’s dive in!
In this episode of Market